Yuanyuan Wang, Yitong Yan, Bin Zhou, Mingyan Lin. Post-transcriptional dysregulation in autism, schizophrenia, and bipolar disorder[J]. The Journal of Biomedical Research. DOI: 10.7555/JBR.38.20240114
Citation:
Yuanyuan Wang, Yitong Yan, Bin Zhou, Mingyan Lin. Post-transcriptional dysregulation in autism, schizophrenia, and bipolar disorder[J]. The Journal of Biomedical Research. DOI: 10.7555/JBR.38.20240114
Yuanyuan Wang, Yitong Yan, Bin Zhou, Mingyan Lin. Post-transcriptional dysregulation in autism, schizophrenia, and bipolar disorder[J]. The Journal of Biomedical Research. DOI: 10.7555/JBR.38.20240114
Citation:
Yuanyuan Wang, Yitong Yan, Bin Zhou, Mingyan Lin. Post-transcriptional dysregulation in autism, schizophrenia, and bipolar disorder[J]. The Journal of Biomedical Research. DOI: 10.7555/JBR.38.20240114
Unproofed Manuscript: The manuscript has been professionally copyedited and typeset to confirm the JBR’s formatting, but still needs proofreading by the corresponding author to ensure accuracy and correct any potential errors introduced during the editing process. It will be replaced by the online publication version.
Post-transcriptional dysregulation in autism, schizophrenia, and bipolar disorder
Mingyan Lin, Department of Neurobiology, School of Basic Medical Sciences, Nanjing Medical University, 101 Longmian Avenue, Jiangning District, Nanjing, Jiangsu 211166, China. E-mail: linmingyan@njmu.edu.cn
Bin Zhou, Department of Cardiology, the First Affiliated Hospital of Nanjing Medical University, 300 Guangzhou Rd, Nanjing, Jiangsu 210029, China. E-mail: bin_zhou@yahoo.com
The alteration of gene expression is not restricted to transcriptional regulation but includes a variety of post-transcriptional mechanisms, however, the role of the latter underlying many diseases remains relatively unknown. By utilizing an RNA-Seq dataset of 1510 brain samples from individuals with autism spectrum disorder (ASD), bipolar disorder (BD), schizophrenia (SCZ), and controls, we assessed the contribution of post-transcriptional dysregulation and identified top perturbators accountable for transcriptomic changes of expression in neuropsychiatric disorders. Around 30% of the variability in expression can be attributed to post-transcriptional dysregulation. Interestingly, RNA stability tended to decrease in SCZ and BD, leading to the inhibition of neurogenesis and neural differentiation, while the increase in ASD, resulted in enhanced activity of apoptosis. This finding implicated contrasting pathologies involving RNA stability among neuropsychiatric disorders. An RNA binding protein (RBP)-ELAVL3 – is predicted to be significantly involved in the disruption of RNA stability in all three disorders. To validate, we knocked down its expression in cerebral organoids. Not only differentially expressed genes in ELAVL3-knockdown covered a considerable proportion of predicted targets in three disorders, we also found neurogenesis was significantly affected, given the diminished proliferation and consequently the reduced size of the organoids. Our study extends the current understanding of the link between post-transcriptional regulation and neuropsychiatric disorders and provides new therapeutic targets for early intervention.
Genetic factors are believed to play an important role in the pathogenesis of neuropsychiatric disorders, including schizophrenia (SCZ), bipolar disorder (BD), depression, and autism (ASD)[1]. Thanks to the advance of sequencing technology, recent studies have revealed that the majority of risk loci lie in the regulatory regions (i.e. non-coding region of gene) rather than the coding region[2], suggesting that dysregulation of gene expression and alternative splicing be more relevant to the development of neuropsychiatric disorders compared to malfunction of the genes. Gene expressions are jointly regulated by the transcriptional mechanism (TGR) and the post-transcriptional mechanism (PTGR). The former has been the focus of decades' studies, leading to the extensive understanding of the role of many transcription factors and epigenetic patterns in neuropsychiatric disorders, including our previous studies of the SCZ risk gene ZNF804A and TCF4[3], 22q11.2 microdeletion and ASD high gene CHD8[4]. PTGR contributes to almost every aspect of RNA metabolism, such as splicing, maturation, transportation, and degradation[5]. mRNAs are primarily regulated by microRNAs (miRNAs) and RBPs. Despite the long debate regarding which plays a more important role in PTGR, there is emerging evidence that RBPs, given their involvement in many aspects of RNA metabolism, have a much larger influence than miRNAs, which mainly take part in the degradation[6]. However, our current knowledge about the association between RBPs and neuropsychiatric disorders is restricted to a few genes such as FMR1, DISC1, and the members of the RBFOX family. Recent studies have dramatically expanded the pool of RBPs, the number of which is estimated to be not less than eight hundred[7]. Therefore, a transcriptome-wide assessment of PTGR dysregulation and identification of potential risk RBPs are quite valuable to deciphering complex neuropsychiatric disorders.
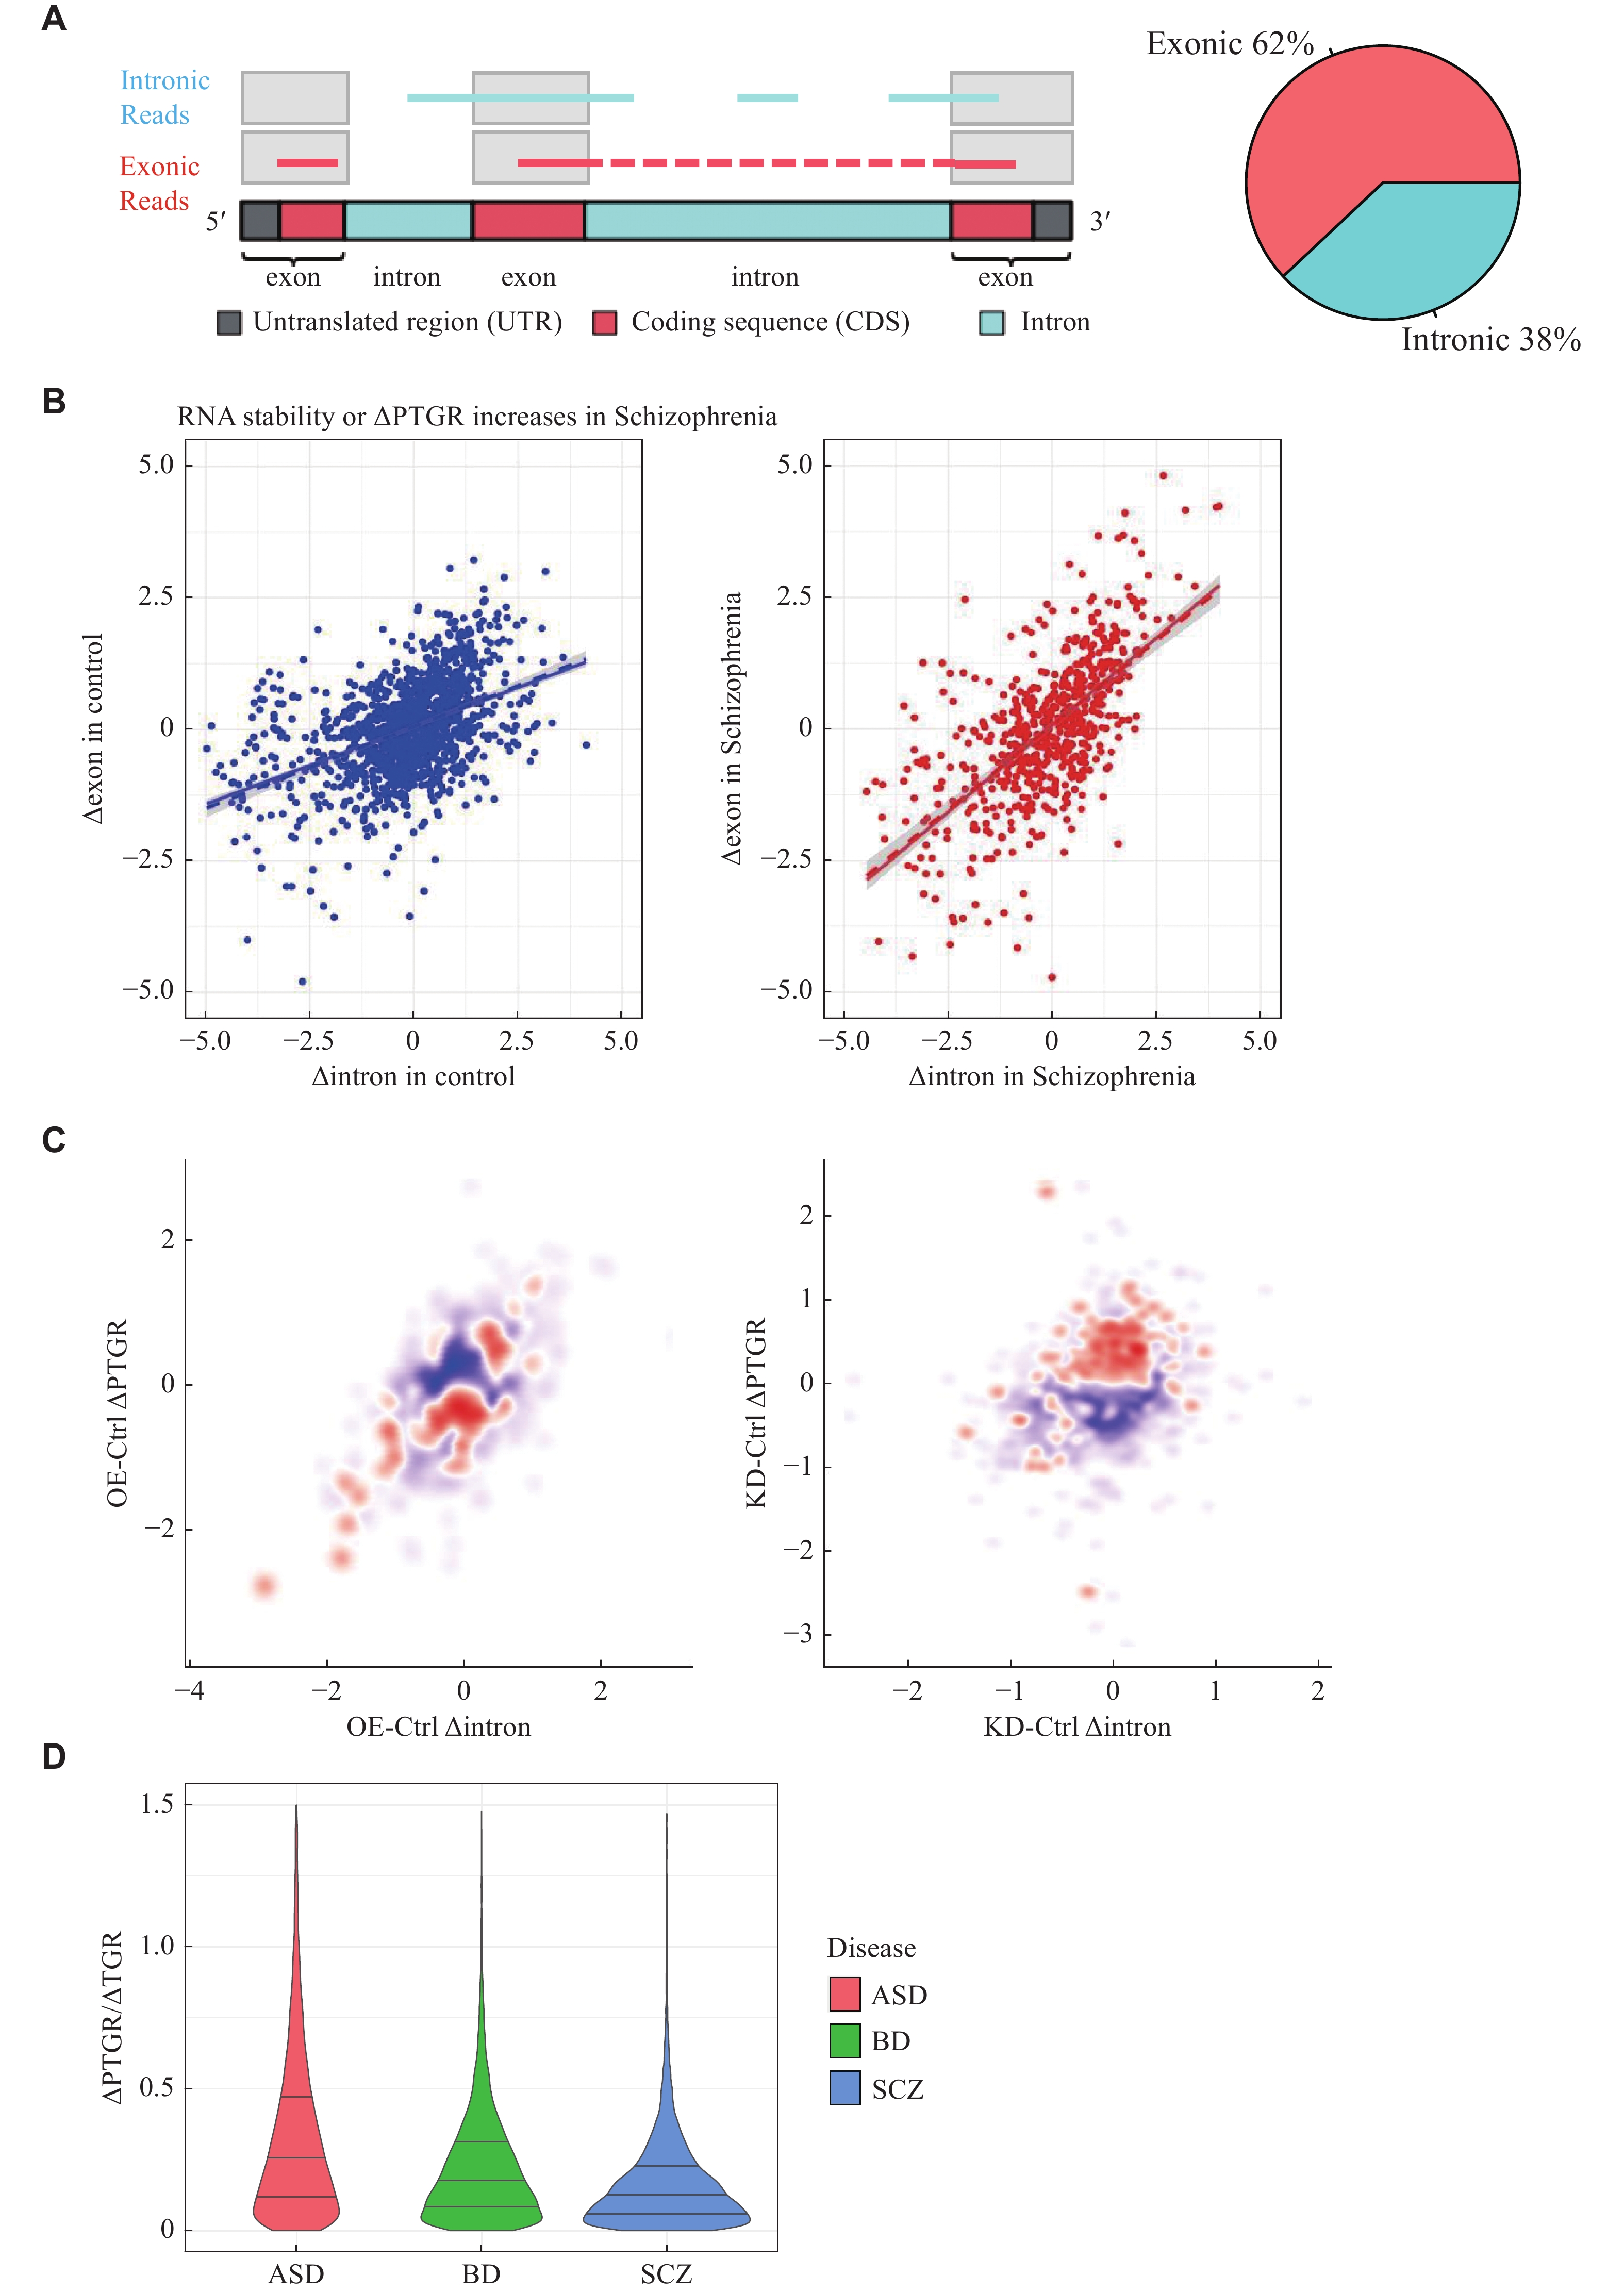
Several studies showed that alteration in TGR and PTGR could be evaluated simultaneously based on RNA-seq data. The rationale is that the number of reads mapped to intronic regions can represent the expression level of pre-mRNAs, which are mainly transcriptionally regulated[8–9], while those mapped to the exonic regions can represent the expression level of mature mRNAs, which are transcriptionally and post-transcriptionally regulated (Fig. 1A). Hence, subtraction of changes in exonic levels (Δexon) by changes in intronic levels (Δintron) can reflect alteration in PTGR across conditions, though many technical and biological factors should be taken into account to avoid biases, which may overestimate the change of PTGR[10].
Figure
1.
An unbiased pipeline to assess the contribution of PTGR dysregulation to expression.
A: The theoretical basis schematic diagram of the PTGR estimation algorithm (left). The fraction of exonic reads and intronic reads in the PsychENCODE bulk RNA-Seq dataset is shown in the pie chart. (right). The intronic reads represent the abundance of pre-mRNAs, and the exonic reads represent the abundance of mature mRNAs. B: The schematic diagrams of the PTGR estimation method. Scatter plots comparing PTGR of disease (left) and control(right). The y-axis represents the changes in exonic reads. The x-axis represents the changes in intronic reads. Each dot represents a sample, and the solid line represents the fitted line. C: The scatter plot shows the miR-9 seed sequence enrichment in genes of miR-9 knockdown (KD) (left) and miR-9 overexpression (OE) (right). The y-axis represents the changes in exonic reads. The x-axis represents the changes in intronic reads. Each dot represents a gene, and the color represents the degree of enrichment of genes with miR-9 seed sequence in the 3′ UTR, with red representing enrichment and blue representing depletion. D: The violin plot shows the ratio of the change of the PTGR in disease versus control to the TGR in disease versus control using the formula (2) in the Materials and methods section. The ratio represents the relative contribution of PTGR dysregulation to changes in gene expression levels compared with that of TGR dysregulation of each gene. The average ratio of all genes and all diseases was 0.30 (30%). The three lines within the violin plot represent the 75%, median, and 25% percentiles from top to bottom. ASD, BD, and SCZ are displayed in red, green, and blue, respectively.
Following the idea above, we developed an unbiased algorithm to assess PTGR dysregulation in three common psychiatric disorders (ASD, SCZ, and BD) based on a large public dataset of 1510 brain transcriptome data from the PsychENCODE Consortium[11], including 80 ASD samples, 428 SCZ samples, and 188 BD samples. We found PTGR dysregulation contributes significantly to expression change in diseases and identified the most likely responsible RBPs. To validate our algorithm, we knocked down the most relevant RBPs-ELVAL3 in cerebral organoids and examined its role in neurodevelopment. In summary, our study provided an unbiased and reliable method to assess PTGR dynamics, highlighted the involvement of PTGR dysregulation underlying neuropsychiatric disorders, and listed several potential targets for further research from the post-transcriptional perspective.
Materials and methods
Ethics and data collection
The ethics committee of Nanjing Medical University approved the study ([2020] No. 525).
For this study, all processed bulk RNA-seq alignment (.bam) files were collected from the PsychENCODE consortium (https://www.synapse.org/#!Synapse:syn6039873). Bulk RNA-Seq samples clinical data are available at https://www.synapse.org/#!Synapse:syn4587614. The reference genome for all files is hg19. Of the 2160 samples in the PsychENCODE consortium, 1510 samples are rRNA depletion sequencing samples with sufficient intronic reads (control n=814, SCZ n=428, BD n=188, ASD n=80). We will subsequently analyze the 1510 samples.
Annotation of exon and intron reads
We extracted the intron coordinates of genes from genecode.v19.gtf as the intron GTF annotation file. We extracted the coordinates of exons and untranslated regions within any isoform of a gene from genecode.v19.gtf as the composite exon GTFs annotation file. We used featureCounts[12] (version 2.0.3) to separately quantify the abundance of exon and intron at the gene level.
Covariate selection
We calculated the TPM of each gene using exon abundance. For subsequent analysis, we only retained genes with TPM>1 in at least 50% of the samples.
Missing values in clinical data were imputed using the missMDA R package[13] (version 1.19).
To determine which covariates will affect the evaluation of gene post-transcriptional regulation, we performed multivariate adaptive regression using the earth R package[14] (version 5.3.3) on the intronic and exonic count. We included a superset of potential covariates available for all samples, including study, tissue, libraryPrep, strand specificity, platform, individual ID Source, diagnosis, sex, ethnicity, PMI, RIN, ageDeath, and all 40 sequencing principal components, along with squared terms for continuous variables. The limma normalized gene expression data and covariates as inputs for earth model analysis. As the model fits a maximum of 1000 genes simultaneously, we performed 1000 permutations randomly sampling 1000 genes at a time. Finally, we selected a set of covariates those present in the exons and introns, including study, diagnosis, sex, ethnicity, PMI, ageDeath, PC (1-3), PC (5-11), PC (13-18), PC20, PC22, PC23, PC (25-27), PC29, PC31, PC (33-36), PC39, RINS2, ageDeathS2, PC1S2, PC2S2, PC4S2, PC6S2, PC9S2, PC16S2, PC17S2, PC22S2.
Exonic/Intronic counts correction
The exonic/intronic counts were normalized for library size using TMM normalization in edgeR[15] (version 3.40.2) and were transformed as log2(CPM). We used the nlme[16] (version 3.1-162) R package to correct the exonic and intronic counts based on the linear mixed-effects model. We treated the log2(CPM) counts of exonic/intronic as the dependent variable in the mode and the covariates and disease groups specified in the previous section as fixed effects in the model. In addition, each unique subject was treated as the random effect term in the model. All covariates except diagnosis and subject were regressed from our exonic/intronic count dataset. Exonic and intronic counts were analyzed separately.
New PTGR estimation pipeline
Reads in the intron region reflect the expression level of pre-mRNA, and reads in the exon region reflect the expression level of mature mRNA[8]. We subtracted the median exon count of each gene from the exon count of all samples to obtain the change in exon count (Δexon). The analysis process for change in intron count (Δintron) is as above.
For each control, SCZ, ASD, and BD set, we used robust linear regression to model the ratio of Δexon and Δintron for each gene. The control group ratio is recorded as slope A. We used the same method to estimate the ratio of ∆exon and ∆intron in the disease group. The disease group ratio is recorded as slope B. If B>A, it means that PTGR is up-regulated in the B(disease) group (∆PTGR > 0), and represents the increased RNA stability in the disease group. Positive and negative ∆PTGR values correspond to increased and reduced RNA stability. The test shown below is used to quantify the statistical significance of ∆PTGR:
Here, the Slope represents the robust linear regression slope value, and SE represents the standard error of the Slope. The df is the sum of samples in the control and disease groups.
For each gene, the effect of PTGR versus TGR (transcription gene regulation) on gene expression can be estimated according to the following formula:
ratio=|slope(Disease)slope(Ctrl)−1|
(2)
This ratio represents the relative contribution of PTGR dysregulation of each gene to changes in gene expression levels compared with TGR dysregulation.
The average ∆PTGR of each gene was obtained from the above analysis. To measure the ∆PTGR (∆ PTGR_in) of each gene in each individual of the disease, we used the following formula:
We used RNA-seq data of schizophrenia patient-derived neural progenitor cells (GEO accession GSE80170) with microRNA-mediated post-transcriptional perturbation[17] to evaluate the performance of the PTGR algorithm. The data include control samples, samples with the miR-9 knockdown (KD), and samples with the miR-9 overexpression. We used STAR[18] with default parameters aligned reads to the hg19 reference genome. We used custom intronic GTF and composite exonic GTF for read annotation, and gene-level abundance was quantified for intronic and exonic separately using featureCounts. We identified genes inferred to be up-PTGR or down-PTGR in the knockdown/overexpression group. Because miRNA targets the miRNA seed in the 3′ UTR to exert regulatory effects, we examined whether genes that were up-PTGR or down-PTGR were enriched for miR-9 RNA seed sites in their 3′ UTRs to evaluate the performance of PTGR algorithm.
The results of the differential expression genes (DER-13_Disorder_DEX_Genes.csv) of three neuropsychiatric disorders were retrieved from the PsychENCODE database (http://resource.psychencode.org).
Identification of key RBPs
We first download the position frequency matrices (PFMs) of human RBPs from the beRBP database (http://bioinfo.vanderbilt.edu/beRBP/). We used the MoSBAT[19] (version 1.0.0) to assess the similarities of all PFMs and cluster the PFMs to generate the non-redundant RBP binding PFM set. Then, we used MoSBAT to perform RBP PFM scanning in the 3′ UTR sequence of the DPRGs gene to obtain vectors for the binding of RBPs on DPRGs. To reduce the alternative splicing confounding effects, we only included genes with the same 3′ UTR start coordinates for all isoforms. We used the RNA stability measures of DPRGs as the response variable in linear regression, with the RBP binding vector of DPRGs as predictor variables. RBPs and miRNAs significantly associated with disease-specific stability were identified based on the regression coefficients at P-value < 0.05. If the gene's 3′ UTR sequence contains an RBP binding site, the gene is predicted to be the binding target of the RBP (RBP-bound gene).
Development of human cerebral organoids
The wild-type human induced pluripotent stem cell lines (iPSC) (NC3-1, passage 16; ihtc-03, passage 20) were presented by Dr. Yan Liu's laboratory (Nanjing Medical University, China). All stem cell lines were cultured with Essential eight (E8) medium (Life Technologies, USA) at 37 °C and 5%CO2, and the E8 medium was changed daily.
After culturing iPSCs clone in E8 medium for 7 days, iPSCs were dissociated using ethylenediaminetetraacetic acid (EDTA) (Lonza, USA) at 37 °C for 1 minute. Next, we seeded iPSC in a 6-well plate at a density of approximately 1x10^5 cells per well. We used dispase (Life Technologies, USA) to detach iPSC. Then, we cultured detached iPSC in the neural induction medium (NIM) (490 mL DMEM/F12 medium, 5 mL of N2 supplement (Gibco, USA), 5 mL of minimum essential medium non-essential amino acids (MEM-NEAA) (Gibco)) to form embryoid bodies (EB). Half the NIM medium was changed out every day from day 1 to day 6. On day 7, we resuspended the EB in Matrigel (Corning, USA) and cultured it in the differentiation medium, which changed every five days.
Genome editing
Genome editing of cerebral organoids was conducted by Promoter Biotechnology (Jiangsu, China). We used CRISPR/Cas9 genome edit technology to generate the ELAVL3 KD NC3-1 and ihtc-03 iPSC lines. The guide RNA sequences of ELAVL3 for the targeting site were as follows: forward, 5′-CTTGTCCCGAACCAACTTGC-3′; reverse, 5′-TTTGTACCAAGGAGTGGCCC-3′. We used the trizol kit (Thermo Fisher Scientific, USA) to extract total RNA and then reverse-transcribed it into cDNA. We conducted qPCR to cDNA using the SuperScript III First-Strand Synthesis System (Thermo Fisher Scientific). The primers used for qPCR were as follows: ELAVL3 forward primer, 5′-TCGAGTCCTGCAAGTTGGTTC-3′; reverse primer, 5′-TGCATCATTGGGGTCAGAATAGT-3′.
Immunostaining
We used 4% paraformaldehyde (Beyotime, China) to fix organoids in the Eppendorf tube for 2 hours and used PBS (Beyotime) to wash them three times. Next, we used PBS with 20% sucrose (Beyotime) to submerge the organoids overnight at 4 °C. When the organoids sank to the tube bottom, we replaced the soaking solution with 30% sucrose in PBS at 4 °C. We embedded organoids in the OCT compound (SAKURA, Japan) and cryosectioned it at 10 μm to generate tissue sections. We first washed organoid sections with PBS 3 times and then used 1% Triton (Biolink, China) and 5% donkey serum (Millipore, Germany) in PBS blocked and permeabilized organoid sections. Subsequently, we used primary antibody diluted in 0.2% Triton and 5% donkey serum to incubate sections at 4 °C overnight. Then, we used the secondary antibody diluted in 5% donkey serum incubated sections for 1 hour at 20 °C. We used PBS to perform three 10-minute washes. Finally, we fixed the mounted coverslip and used the Eclipse 80i fluorescence microscope (Nikon, Japan) for imaging. Antibodies used in this study include Ki67 (Rabbit IgG, dilution 1:200, Cat. #18-0191, ZYMED, USA); MAP2 (Mouse IgG, dilution 1:1000, Cat. #M1406, sigma, USA).
Bulk RNA-Seq differentially expression analysis
Total RNA from day-30 ELAVL3-KD cerebral organoids from NC3-1 and ihtc-03 iPSC lines and control cerebral organoids from NC3-1 and ihtc-03 iPSC lines were extracted, and library construction was conducted by annoroad gene technology (China). Sequencing was performed with the DNBSEQ-T7 platform (BGI, China). We used HISAT2[20] software (version 2.1.0.) to align reads to the hg19 reference genome. Differentially expressed genes between the ELAVL3-KD and control cerebral organoids were identified using DESeq2[21] (version 1.38.3) R package. Genes with |log2fold change| > 0 and adjusted P-value < 0.05 were treated as significant differential expressed.
Developmental expression data
The expression data of the developing human brain was from the BrainSpan database (http://www.brainspan.org/).
Enrichment analysis
We used the R package clusterProfiler[22] (version 4.6.0) to perform gene ontology (GO) enrichment analysis. The GO interactome network was performed by Metascape[23] (version 3.5).
To determine whether differentially expressed genes in ELAVL-KD cerebral organoids were significantly enriched with psychiatric disorders susceptibility genes, we overlapped the differentially expressed genes with the susceptibility gene list of the autism DB database, Fromer M et al[24], SFAIR autism database, Gulsuner S et al[25], BipEX database, and Li M et al[26]. Then, we used Fisher's exact one-sided test to perform susceptibility gene enrichment analysis.
We used MEME[27] (version 5.5.0) with default parameters to identify the motif of 3′ UTR sequence.
Statistical analysis
Experimental statistical data are reported as mean ± SEM. Student's t-test was used for statistical analysis between two groups, and ANOVA was used for statistical analysis of multiple groups. Other statistical tests were listed in the legend or method section of each figure.
Results
An unbiased pipeline to assess the contribution of PTGR dysregulation to expression
For an unbiased estimate of expression changes due to post-transcriptional dysregulation, we developed a computational analytic pipeline of RNA-seq data as follows. The change in the abundance of intronic reads (Δintron) across different conditions corresponds to the change in transcriptional level while the changes in the abundance of exonic reads (Δexon) across different conditions correspond to the changes in both transcriptional and post-transcriptional levels (Methods and Fig. 1A). We first quantified the abundance of exonic and intronic reads in PsychENCODE RNA-seq datasets. As expected, we found that about 38% of reads were intronic reads, and 62% of reads were exonic reads (Fig. 1A). This observation is in agreement with previous studies[8–9], suggesting there is sufficient reads from pre-mature mRNA for our analytic purpose. We modeled the difference between Δexon and Δintron (∆PTGR) for each gene in each group by robust linear regression to remove biases from confounding factors (Methods and Fig. 1B). If the regression slope in the disease group is larger than that in control group, this means that the PTGR is up-regulated in the disease group (∆PTGR > 0), or in other word RNA stability (expression due to post-transcriptional regulatory programs) is increased in the disease group. In sum, positive and negative ∆PTGR values correspond to increased and reduced RNA stability.
To evaluate the performance of our pipeline, we measured ΔPTGR using RNA-seq data of SCZ patient-derived neural progenitor cells with purely post-transcriptional perturbations mediated by microRNAs (miR-9)[17]. miRNA degrades its targets by binding their 3′ UTR with the seed region. As expected, our results indeed showed that genes that were downregulated at the PTGR level in the miR-9 overexpression condition and upregulated at the PTGR level in the miR-9 knockdown condition were both significantly enriched for the miR-9 direct targets (Fig. 1C).
To assess the relative contribution of TGR and PTGR dysregulation to expression change across three common psychiatric disorders, we next applied our pipeline to the 1510 brain transcriptome samples from the PsychENCODE Consortium. The result revealed that the relative contribution of PTGR dysregulation to changes in gene expression levels was on average approximately 30% of that of TGR dysregulation (Fig. 1D), although there is indeed a small proportion of genes whose expression is altered primarily in a post-transcriptional manner. Moreover, we found transcription factors were significantly overrepresented in DPRGs (terms Differentially Post-transcriptionally Regulated gene, DPRGs) (Fig. 2F), suggesting PTGR dysregulation might have a profound impact on gene expression by affecting many upstream regulators. Our work uncovered for the first time how important PTGR dysregulation could be to the pathogenesis of common neuropsychiatric disorders in terms of gene expression.
Figure
2.
Transcriptome-wide targets of PTGR dysregulation in neuropsychiatric disorders.
A: The density plot shows the distribution of ∆PTGR within the expressed genes in three diseases. The ∆PTGR > 0 represents the increase of RNA stability (disease versus control), whereas ∆PTGR < 0 represents the decrease of RNA stability (disease versus control). B: The Venn diagram shows the overlapping of significantly differential PTGR (FDR < 0.05) genes. Genes of ASD, BD, and SCZ are displayed in red, green, and blue, respectively. C: The scatter plot shows the degree of correlation of ∆PTGR between diseases. Each dot represents a gene. The color represents the localized density of genes. Red represents high gene density, and the blue represents low gene density. The dotted line represents the fitted line. D: The gene ontology functional enrichment results of upregulated DPRGs in disease. Numbers in parentheses represent the count of genes in each disorder. E: The gene ontology functional enrichment results of downregulated DPRGs in disease. Numbers in parentheses represent the number of genes in each disorder. F: The bar plot shows the degree of enrichment of regulatory elements AREs (up) and transcription factors(bottom) in DPRGs and DEGs in three diseases using Fisher's exact test.
Transcriptome-wide targets of PTGR dysregulation in neuropsychiatric disorders
We first assessed post-transcriptional alteration genome-wide in ASD, SCZ, and BD compared with control. Intriguingly, not only were ASD more vulnerable to PTGR dysregulation (Fig. 1D and Fig. 2A), we also noticed that mRNAs appeared to be significantly more stable in ASD, in contrast to SCZ and BD in which mRNAs stability showed the opposite pattern (Fig. 2A). We identified widespread genes whose expression were significantly post-transcriptionally altered in ASD, SCZ, and BD [n =1807, 1019, and 979 genes at false discovery rate (FDR) < 0.05, respectively] (Fig. 2B), most of which were not shared across disorders. Nevertheless, transcriptome-wide comparison of ∆PTGR across three disorders showed a significant SCZ/BD cross-disorder correlation (Fig. 2C), implying that SCZ and BD may share overlapping post-transcriptional etiology, while post-transcriptional dysregulation in ASD is more likely to be unique among disorders (Fig. 2C). To gain an insight into the biological impacts of PTGR dysregulation, we subsequently performed Gene Ontology (GO) analysis of ASD-, SCZ-, and BD-associated DPRGs, respectively. Genes involved in the apoptotic process were enriched in ASD-associated up-regulated DPRGs (Fig. 2D), while SCZ-/BD up-regulated DPRGs showed significant enrichment in immune activation related biological processes (Fig. 2D). Moreover, down-regulated DPRGs were associated with neural development, neuron differentiation, and synaptic transmission in SCZ/BD (Fig. 2E). However, there is no enrichment of biological process in ASD-associated down-regulated DPRGs (Fig. 2E). Together, these results suggested that the disease specificity and complexity across three disorders are partially attributed to PTGR dysregulation.
Disease-specific RBPs that modulate mRNA stability in psychiatric disorders
Since RBPs modulate mRNA stability via the Adenylate-uridylate (AU)-rich elements (AREs) and regulate the expression of many genes at the post-transcriptional level[28], we examined whether DPRGs were enriched with AREs. We observed ARE enrichment in DPRGs, but not in differentially expressed genes (DEGs) (Fig. 2F). This result supported the potential involvement of RBPs in modulating DPRGs across three disorders. To predict the most responsible RBPs, we leveraged the sequence preference of known RBPs and examined the association between transcriptome-wide ∆PTGR and counts of binding sites of each RBP with multiple linear regression (see Methods for more details). Consequently, we identified multiple RBPs highly predictive of transcriptome-wide mRNA stability in different disorders (Fig. 3A). Known ASD and SCZ risk RBPs such as FMR1 and QKI[29–30] are among the top candidates. Other promising candidates include neurodevelopment-associated ELAVL3[31] and IGF2BP family[32], neuroimmune-related gene ZPF36, and classical splicing factor SRSF1. More importantly, the impacts of these RBPs on RNA stability were consistent with their roles verified experimentally in the literature[33]. For instance, FMR1 represses translation by reducing mRNA stability[34]. Our analysis predicted that transcriptome-wide targets of FMR1 tend to increase in mRNA stability in ASD (Fig 3A top left), as expression of FMR1 decreased in ASD (Fig 3A top right). Collectively, our study provided an interesting list of risk RBPs worth further research attention.
Figure
3.
Disease-specific RBPs that modulate RNA stability in psychiatric disorders.
A: RBPs highly predictive of transcriptome-wide mRNA stability in different disorders are shown (P-value < 0.05, t-test of regression coefficients). The bar plot (left) shows the predicted key RBPs and the corresponding RBP binding motif. Y axis within the left bar plot represents the average PTGR of predicted RBPs-bound target genes in disease versus control. The bar plot (right)shows the average log2fold-change of the expression of RBP in disease versus control. B: The normalized expression of ELAVL3 of the developing brain at different developmental time points and brain regions. Data from the BrainSpan Atlas database. Red denotes high expression, and blue denotes low expression. W: Development stage window. W1: 8, 9 post-conceptional weeks. W2: 12, 13 post-conceptional weeks. W3: 16, 17 post-conceptional weeks. W4: 19-21 post-conceptional weeks. W5: 24 post-conceptional weeks -0.3 years. W6: 0.5-2 years. W7: 3-11 years. W8: 13-19 years. W9: 21-64 years. MFC: rostral medial prefrontal cortex. DFC: dorsolateral prefrontal cortex. S1C: primary somatosensory cortex. M1C: primary motor cortex. V1C: primary visual cortex. OFC: orbital frontal cortex. VFC: ventrolateral prefrontal cortex. A1C: primary auditory cortex. ITC: inferolateral temporal cortex. STC: posterior superior temporal cortex. IPC: posteroventral parietal cortex. C: The heatmap shows the ∆PTGR of 159 predicted ELAVL3-bound genes in three diseases. The ∆PTGR represents the changes of the PTGR in disease versus control. D: The box plot shows the average expression of 159 ELAVL3-bound genes at different developmental stages. The stage windows of W1-9 correspond to the developmental time windows in Fig 3B. E: Enrichment analysis of ELAVL3-bound genes. Each color represents a kind of biological process category.
ELAVL3 responsible for the disruption of RNA stability in all three disorders
Intriguingly, we found ELAVL3, a neural-specific RNA-binding protein that preferentially expresses on early brain development (Fig. 3B), among top candidates for all three disorders with the opposite effects between SCZ/BD and ASD. ELAVL3 was upregulated in ASD and targets of ELAVL3 were more stable in ASD, while it was downregulated in SCZ/BD and its targets were less stable in SCZ/BD (Fig. 3A andC). Therefore, the presence of 3′ UTR binding sites for ELAVL3 was significantly associated with increased mRNA stability. We subsequently assessed the expression of 159 ELAVL3-bound genes. We found that the average expression of ELAVL3-bound genes was also high in brain development (Fig. 3D), consolidating the important role of ELAVL3 in early brain development. The ELAVL3-bound genes were significantly enriched in the core biological processes implicated in three disorders above, such as neurodevelopment, regulation of the apoptotic process and neuron differentiation (Fig. 3E). Overall, our study pointed to an RBP whose malfunction may underlie the common pathogenesis shared by three disorders.
Knock-down of ELAVL3 causing developmental defect of cerebral organoid
To validate the post-transcriptional role of ELAVL3 in neurodevelopment, we knocked down it on the cerebral organoid, which is a powerful 3D cellular model to study the early development of human brain or neuropsychiatric disorders (Fig. 4A)[35]. Downregulation of ELAVL3 was confirmed by qPCR (Fig. 4B). Intriguingly, the number of proliferating cells, marked by Ki67, was significantly decreased following knock-down of ELAVL3 (Fig 4C and D). Consequently, the size of the organoids was also significantly reduced (Fig. 4E and F). RNAseq analysis identified 832 differentially expressed genes (ELAVL3-KD-DEGs) (Fig 5A), which were primarily involved in neurogenesis (Fig 5B) and whose 3′ UTR sequences were enriched with the same binding motifs of ELAVL3 as recorded in BeRBP database (Fig 5C). The predicted 159 bound targets of ELAVL3 tend to have decreased expression upon knock-down of ELAVL3, supporting their reduced RNA stability (Fig 5D). More importantly, known ASD/BD/SCZ risk genes were overrepresented in ELAVL3-KD-DEGs (Fig 5E), corroborating the link between common neuropsychiatric disorders and developmental defects due to abnormal expression of ELAVL3.
Figure
4.ELAVL3-KD cerebral organoids.
A: Schematic diagram shows the generation of ELAVL3 knockdown organoids using the CRISPR/Cas9. Blue sequence: gRNA; yellow sequences: PAM sequences. B: Relative expression levels of ELAVL3 in day 30 ihtc-03 derived cerebral organoids and day 30 ELAVL3-KD ihtc-03 derived cerebral organoids as assessed by qPCR. Data were reported as mean ± SEM (n=3). The statistical analysis was performed using the student's t-test. ***P < 0.001. C: Immunofluorescence of Ki67-positive and MAP2-positive cell after 30 days of differentiation. Ki67: proliferating radial glial progenitor marker. MAP2: neuron marker. Top: control cerebral organoids at day 30. Bottom: ELAVL3-KD cerebral organoids at day 30. Scale bar: 20 μm. D: Quantification of the proportion of Ki67-positive cells in ELAVL3-KD and control organoids after 30 days of differentiation. n = 15 – 40 ventricular zone-like regions in at least 5 organoids per cell line. Data represent the mean ± SEM. ***P < 0.001, by 1-way ANOVA. E: Bright-field microscopic images of ihtc-03 differentiated cerebral organoids at day 13. Top: Cerebral organoids at day 13. Bottom: ELAVL3-KD cerebral organoids at day 13. Scale bar: 250 μm. F: Quantification of organoids perimeter on day 13. At least 38 EBs were analyzed for each cell line; n ≥3 independent experiments. Data represent the mean ± SEM. ***P < 0.001, by one-way ANOVA.
Figure
5.
Transcriptional analyses in cerebral organoids derived from ELAVL3-KD and control iPSCs.
A: The heatmap of the significant differentially expressed genes from comparing the ELAVL3-KD cerebral organoids with control cerebral organoids using DESeq2. The highly-expressed gene is red, and the low-expressed gene is blue. B: Differentially expressed genes enriched GO terms based on the GSEA GO analysis as ranked by the number of core enrichment gene counts. C: Top: The classical RNA binding motif of ELAVL3 from the beRBP database. Middle: Motif of the 3′ UTR sequence of 159 predicted ELAVL3-bound genes with significant ∆PTGR by MEME software enrichment. Bottom: Motif of the 3′ UTR sequence of the significant differentially expressed genes (P < 0.05 and |log2FC| > 1) in the ELAVL3-KD cerebral organoids by MEME software enrichment. D: The density plot shows the distribution of the expression changes of different gene sets in control and ELAVL3-KD cerebral organoids. The X-axis shows the log2FC of ELAVL3-KD versus control cerebral organoids. The purple color represents the ELAVL3-bound genes, and the green color represents all expressed genes in cerebral organoids. The definition of ELAVL3-bound genes is the same as Fig. 3C. E: Enrichment for the significant differentially expressed genes in the ELAVL3-KD cerebral organoids in neuropsychiatric gene sets. The odd ratio was generated using Fisher's exact test. The asterisk shows that the P-value was less than 0.05. The autism_DB_ASD and autism_DB_SCZ gene sets were collated from the autismDB database. The Fromer M et al._denovo_ASD, Fromer M et al._denovo_ID, and Fromer M et al._denovo_SCZ gene sets were collated from Fromer M et al.[24]. The SFAIR_ASD_2024_release gene set was collated from the SFAIR autism database. The Gulsuner S_denovo_SCZ gene set was collated from Gulsuner S et al.[25]. The BipEX_BD gene set was collated from the BipEX database. The Li M et al._AD gene set was collated from Li M et al.[26]. ASD: Autism spectrum disorders. SCZ: Schizophrenia. ID: Intellectual disability. BD: Bipolar disorder. AD: Alzheimer's disease.
We investigated the role of PTGR dysregulation underlying neuropsychiatric disorders, with a specific focus on its influence on gene expression. Our comprehensive study revealed for the first time that PTGR dysregulation was widespread and unexpectedly not neglectable compared to TGR dysregulation, warranting further attention. The most interesting finding is that, unlike the SCZ/BD brain, the ASD brain appeared to have increased RNA stability in general, implying a novel approach to therapeutically intervene in these diseases by manipulating the kinetics of RNA metabolism.
Our current understanding of the relationship between many diseases and PTGR is primarily restricted to miRNAs, which regulate the degradation and translation of hundreds of mRNAs by binding to the 3′ UTR of mRNAs. Numerous well-characterized miRNAs have been associated with neuropsychiatric disorders, including miR-132, miR-195, miR-188, and miR-137[36], whereas the role of RBPs is relatively unexplored. As far as we know, the human genome encodes more than 1500 RBPs, which is still expanding, yet only a small fraction has been functionally characterized[5]. Encouragingly, our study provided a list of RBPs of top priority for further exploration. Moreover, RBPs regulate the end products of expression more directly than transcription factors, making RBPs more popular targets for drug intervention[37].
Different neuropsychiatric disorders are believed to share part of pathogenesis with each other, and some proposed there was a spectrum of neurodevelopmental disorders on which ASD, BD, and SCZ lie at different ends[38]. From the post-transcriptional perspective, we showed that SCZ and BD might lie closer to each other but far away from ASD on the spectrum. Note that SCZ shared more risk loci with BD than ASD[39]. Thus, our study corroborated the shared pathogenesis between SCZ and BD from a different view. Functional enrichment analysis showed that PTGR abnormalities in SCZ and BD exhibit inhibition of neuron differentiation and synaptic transmission, while PTGR abnormalities in ASD demonstrate excessive activation of apoptosis. A pioneering study analyzed three key brain regions, including the hippocampus, cerebellum, and frontal cortex, in six autistic brains and six non-autistic brains from 6-16 years old deceased children and observed a significant occurrence of endoplasmic reticulum stress, oxidative stress, and apoptosis in the autistic brain[40]. One study showed that amyloid-beta (Aβ) peptides may trigger acquired microcephaly in ASD patients through pathways such as disrupting neurogenesis and promoting cellular apoptosis[41]. The biological impacts of PTGR dysregulation in ASD observed in our study are consistent with the increased apoptosis in the autistic brain. These findings suggested the potential biological consequences of excessive activation of apoptosis due to dysregulation of PTGR in autism, providing clues for future research. In addition, the abnormality of brain neural circuits caused by dysregulation of synaptic organization, differentiation, and transmission is a key molecular mechanism of neurodevelopmental, neuropsychiatric, and neurodegenerative diseases[42]. The pathophysiological changes of synaptic are consistent with the pathways affected by PTGR abnormalities in SCZ and BD. It implies that the synaptic and neuronal differentiation abnormalities caused by PTGR dysregulation in SCZ and BD may influence connectivity in brain circuits, but this requires further exploration. Additionally, our findings revealed distinct sets of RBPs responsible for different disorders, providing support for the goal of not relying on descriptive syndromes but a nosology guided by susceptible genes in psychiatry.
ELAVL3 appeared to be involved in the pathogenesis of all three disorders, though its alteration in expression and its targets were disorder-specific. ELAVL3 is from the ELAVL family of RNA-binding proteins, all members of which function in a spatiotemporal manner to secure brain development[43]. With regard to molecular mechanism, the previous study showed the upregulation of Elavl3 increased RNA stability by lengthening 3′ UTR, consistent with our prediction[44]. Although the SFARI lists ELAVL3 as a risk gene underlying ASD[45], research on ELAVL3 has become centered on putative roles in amyotrophic lateral sclerosis, supported by animal models showing ataxia in elderly and its expression in Purkinje neurons [46]. However, the validation on cerebral organoids suggested ELAVL3 might have a species-specific role. Elavl3−/− null mice have no obvious brain defect[47], while there was an arrest in neurodevelopment following the knock-down of ELAVL3 in organoids. ELAVL3-knockdown cerebral organoids in our study showed diminished proliferation and reduced size. In addition, the cerebral organoids derived from monozygotic twins with discordant psychosis (schizoaffective disorder, bipolar type) iPSCs exhibited reduced cell proliferation following diminished Wnt signaling at the early stage of neurodevelopment[48]. Autism-like mice derived from Gigyf1 haploinsufficiency in the developing mouse brain have fewer neurons in the upper cortex, accompanied by decreased proliferation and increased differentiation of neural progenitor cells[49]. These findings are consistent with our results and simultaneously support the link between diminished cell proliferation and psychiatric disorders. Sawada, T et al. speculated that decreased proliferation during neurodevelopment may impact the brain volume of psychosis-affected individuals before the onset of illness[48]. Another study on SCZ high-risk populations consistently indicates that compared to the control group, the cortical gray matter volume of the diseased population is smaller, suggesting that brain volume is already reduced at the onset of illness, with further reduction in gray matter volume after onset[50]. These results suggest that decreased cell proliferation may be associated with reduced brain volume in patient populations, but further exploration is needed.
Further research is warranted to better understand ELAVL3's function in human brain development, particularly in cortical development, and its malfunction underlying neuropsychiatric diseases, which may lead us to the core pathogenesis.
Fundings
This work received no funding from any source.
Acknowledgments
We appreciate comments from the editor and anonymous reviewers.
Horwitz T, Lam K, Chen Y, et al. A decade in psychiatric GWAS research[J]. Mol Psychiatry, 2019, 24(3): 378–389. doi: 10.1038/s41380-018-0055-z
[2]
Schizophrenia Working Group of the Psychiatric Genomics Consortium. Biological insights from 108 schizophrenia-associated genetic loci[J]. Nature, 2014, 511(7510): 421–427. doi: 10.1038/nature13595
[3]
Wang Y, Liu L, Lin M. Psychiatric risk gene transcription factor 4 preferentially regulates cortical interneuron neurogenesis during early brain development[J]. J Biomed Res, 2022, 36(4): 242–254. doi: 10.7555/JBR.36.20220074
[4]
Wang P, Lin M, Pedrosa E, et al. CRISPR/Cas9-mediated heterozygous knockout of the autism gene CHD8 and characterization of its transcriptional networks in neurodevelopment[J]. Mol Autism, 2015, 6: 55. doi: 10.1186/s13229-015-0048-6
[5]
Gerstberger S, Hafner M, Tuschl T. A census of human RNA-binding proteins[J]. Nat Rev Genet, 2014, 15(12): 829–845. doi: 10.1038/nrg3813
[6]
Jungkamp AC, Stoeckius M, Mecenas D, et al. In vivo and transcriptome-wide identification of RNA binding protein target sites[J]. Mol Cell, 2011, 44(5): 828–840. doi: 10.1016/j.molcel.2011.11.009
Gaidatzis D, Burger L, Florescu M, et al. Analysis of intronic and exonic reads in RNA-seq data characterizes transcriptional and post-transcriptional regulation[J]. Nat Biotechnol, 2015, 33(7): 722–729. doi: 10.1038/nbt.3269
[9]
La Manno G, Soldatov R, Zeisel A, et al. RNA velocity of single cells[J]. Nature, 2018, 560(7719): 494–498. doi: 10.1038/s41586-018-0414-6
[10]
Alkallas R, Fish L, Goodarzi H, et al. Inference of RNA decay rate from transcriptional profiling highlights the regulatory programs of Alzheimer's disease[J]. Nat Commun, 2017, 8(1): 909. doi: 10.1038/s41467-017-00867-z
[11]
Akbarian S, Liu C, Knowles JA, et al. The PsychENCODE project[J]. Nat Neurosci, 2015, 18(12): 1707–1712. doi: 10.1038/nn.4156
[12]
Liao Y, Smyth GK, Shi W. featureCounts: an efficient general purpose program for assigning sequence reads to genomic features[J]. Bioinformatics, 2014, 30(7): 923–930. doi: 10.1093/bioinformatics/btt656
[13]
Josse J, Husson F. missMDA: a package for handling missing values in multivariate data analysis[J]. J Stat Soft, 2016, 70(1): 1–31.
Robinson MD, McCarthy DJ, Smyth GK. edgeR: a Bioconductor package for differential expression analysis of digital gene expression data[J]. Bioinformatics, 2010, 26(1): 139–140. doi: 10.1093/bioinformatics/btp616
[16]
Suk HW, West SG, Fine KL, et al. Nonlinear growth curve modeling using penalized spline models: a gentle introduction[J]. Psychol Methods, 2019, 24(3): 269–290. doi: 10.1037/met0000193
[17]
Topol A, Zhu S, Hartley BJ, et al. Dysregulation of miRNA-9 in a subset of schizophrenia patient-derived neural progenitor cells[J]. Cell Rep, 2016, 15(5): 1024–1036. doi: 10.1016/j.celrep.2016.03.090
[18]
Dobin A, Davis CA, Schlesinger F, et al. STAR: ultrafast universal RNA-seq aligner[J]. Bioinformatics, 2013, 29(1): 15–21. doi: 10.1093/bioinformatics/bts635
[19]
Lambert SA, Albu M, Hughes TR, et al. Motif comparison based on similarity of binding affinity profiles[J]. Bioinformatics, 2016, 32(22): 3504–3506. doi: 10.1093/bioinformatics/btw489
[20]
Kim D, Paggi JM, Park C, et al. Graph-based genome alignment and genotyping with HISAT2 and HISAT-genotype[J]. Nat Biotechnol, 2019, 37(8): 907–915. doi: 10.1038/s41587-019-0201-4
[21]
Love MI, Huber W, Anders S. Moderated estimation of fold change and dispersion for RNA-seq data with DESeq2[J]. Genome Biol, 2014, 15(12): 550. doi: 10.1186/s13059-014-0550-8
[22]
Yu G, Wang L, Han Y, et al. clusterProfiler: an R package for comparing biological themes among gene clusters[J]. OMICS: J Integr Biol, 2012, 16(5): 284–287. doi: 10.1089/omi.2011.0118
[23]
Zhou Y, Zhou B, Pache L, et al. Metascape provides a biologist-oriented resource for the analysis of systems-level datasets[J]. Nat Commun, 2019, 10(1): 1523. doi: 10.1038/s41467-019-09234-6
[24]
Fromer M, Pocklington AJ, Kavanagh DH, et al. De novo mutations in schizophrenia implicate synaptic networks[J]. Nature, 2014, 506(7487): 179–184. doi: 10.1038/nature12929
[25]
Gulsuner S, Walsh T, Watts AC, et al. Spatial and temporal mapping of De novo mutations in schizophrenia to a fetal prefrontal cortical network[J]. Cell, 2013, 154(3): 518–529. doi: 10.1016/j.cell.2013.06.049
[26]
Li M, Santpere G, Imamura Kawasawa Y, et al. Integrative functional genomic analysis of human brain development and neuropsychiatric risks[J]. Science, 2018, 362(6420): eaat7615. doi: 10.1126/science.aat7615
[27]
Bailey TL, Johnson J, Grant CE, et al. The MEME Suite[J]. Nucleic Acids Res, 2015, 43(W1): W39–W49. doi: 10.1093/nar/gkv416
[28]
García-Mauriño SM, Rivero-Rodríguez F, Velázquez-Cruz A, et al. RNA binding protein regulation and cross-talk in the control of AU-rich mRNA fate[J]. Front Mol Biosci, 2017, 4: 71. doi: 10.3389/fmolb.2017.00071
[29]
El Fatimy R, Davidovic L, Tremblay S, et al. Tracking the fragile X mental retardation protein in a highly ordered neuronal ribonucleoparticles population: a link between stalled polyribosomes and RNA granules[J]. PLoS Genet, 2016, 12(7): e1006192. doi: 10.1371/journal.pgen.1006192
[30]
Åberg K, Saetre P, Lindholm E, et al. Human QKI, a new candidate gene for schizophrenia involved in myelination[J]. Am J Med Genet B Neuropsychiatr Genet, 2006, 141B(1): 84–90. doi: 10.1002/ajmg.b.30243
[31]
Ince-Dunn G, Okano HJ, Jensen KB, et al. Neuronal elav-like (Hu) proteins regulate RNA splicing and abundance to control glutamate levels and neuronal excitability[J]. Neuron, 2012, 75(6): 1067–1080. doi: 10.1016/j.neuron.2012.07.009
[32]
Samuels TJ, Järvelin AI, Ish-Horowicz D, et al. Imp/IGF2BP levels modulate individual neural stem cell growth and division through myc mRNA stability[J]. elife, 2020, 9: e51529. doi: 10.7554/eLife.51529
[33]
Ray D, Kazan H, Cook KB, et al. A compendium of RNA-binding motifs for decoding gene regulation[J]. Nature, 2013, 499(7457): 172–177. doi: 10.1038/nature12311
[34]
Shu H, Donnard E, Liu B, et al. FMRP links optimal codons to mRNA stability in neurons[J]. Proc Natl Acad Sci USA, 2020, 117(48): 30400–30411. doi: 10.1073/pnas.2009161117
[35]
Lancaster MA, Knoblich JA. Generation of cerebral organoids from human pluripotent stem cells[J]. Nat Protoc, 2014, 9(10): 2329–2340. doi: 10.1038/nprot.2014.158
[36]
Alural B, Genc S, Haggarty SJ. Diagnostic and therapeutic potential of microRNAs in neuropsychiatric disorders: past, present, and future[J]. Prog Neuropsychopharmacol Biol Psychiatry, 2017, 73: 87–103. doi: 10.1016/j.pnpbp.2016.03.010
[37]
Aartsma-Rus A. New momentum for the field of oligonucleotide therapeutics[J]. Mol Ther, 2016, 24(2): 193–194. doi: 10.1038/mt.2016.14
[38]
Owen MJ, O'Donovan MC. Schizophrenia and the neurodevelopmental continuum: evidence from genomics[J]. World Psychiatry, 2017, 16(3): 227–235. doi: 10.1002/wps.20440
[39]
Cross-Disorder Group of the Psychiatric Genomics Consortium. Identification of risk loci with shared effects on five major psychiatric disorders: a genome-wide analysis[J]. Lancet, 2013, 381(9875): 1371–1379. doi: 10.1016/S0140-6736(12)62129-1
[40]
Dong D, Zielke HR, Yeh D, et al. Cellular stress and apoptosis contribute to the pathogenesis of autism spectrum disorder[J]. Autism Res, 2018, 11(7): 1076–1090. doi: 10.1002/aur.1966
[41]
Sokol DK, Lahiri DK. Neurodevelopmental disorders and microcephaly: how apoptosis, the cell cycle, tau and amyloid-β precursor protein APPly[J]. Front Mol Neurosci, 2023, 16: 1201723. doi: 10.3389/fnmol.2023.1201723
[42]
Yan Z, Rein B. Mechanisms of synaptic transmission dysregulation in the prefrontal cortex: pathophysiological implications[J]. Mol Psychiatry, 2022, 27(1): 445–465. doi: 10.1038/s41380-021-01092-3
[43]
Mulligan MR, Bicknell LS. The molecular genetics of nELAVL in brain development and disease[J]. Eur J Hum Genet, 2023, 31(11): 1209–1217. doi: 10.1038/s41431-023-01456-z
[44]
Grassi E, Santoro R, Umbach A, et al. Choice of alternative polyadenylation sites, mediated by the RNA-binding protein elavl3, plays a role in differentiation of inhibitory neuronal progenitors[J]. Front Cell Neurosci, 2019, 12: 518. doi: 10.3389/fncel.2018.00518
[45]
Iossifov I, O'Roak BJ, Sanders SJ, et al. The contribution of de novo coding mutations to autism spectrum disorder[J]. Nature, 2014, 515(7526): 216–221. doi: 10.1038/nature13908
[46]
Ogawa Y, Kakumoto K, Yoshida T, et al. Elavl3 is essential for the maintenance of Purkinje neuron axons[J]. Sci Rep, 2018, 8(1): 2722. doi: 10.1038/s41598-018-21130-5
[47]
Ince-Dunn G, Okano HJ, Jensen KB, et al. Neuronal Elav-like (Hu) proteins regulate RNA splicing and abundance to control glutamate levels and neuronal excitability[J]. Neuron, 2012, 75(6): 1067–1080.
[48]
Sawada T, Chater TE, Sasagawa Y, et al. Developmental excitation-inhibition imbalance underlying psychoses revealed by single-cell analyses of discordant twins-derived cerebral organoids[J]. Mol Psychiatry, 2020, 25(11): 2695–2711. doi: 10.1038/s41380-020-0844-z
[49]
Chen G, Yu B, Tan S, et al. GIGYF1 disruption associates with autism and impaired IGF-1R signaling[J]. J Clin Invest, 2022, 132(19): e159806. doi: 10.1172/JCI159806
[50]
Brent BK, Thermenos HW, Keshavan MS, et al. Gray matter alterations in schizophrenia high-risk youth and early-onset schizophrenia: a review of structural MRI findings[J]. Child Adolesc Psychiatr Clin N Am, 2013, 22(4): 689–714. doi: 10.1016/j.chc.2013.06.003
 Authors and Reviewers

 DownLoad: