 Authors and Reviewers
Figures of the Article
-
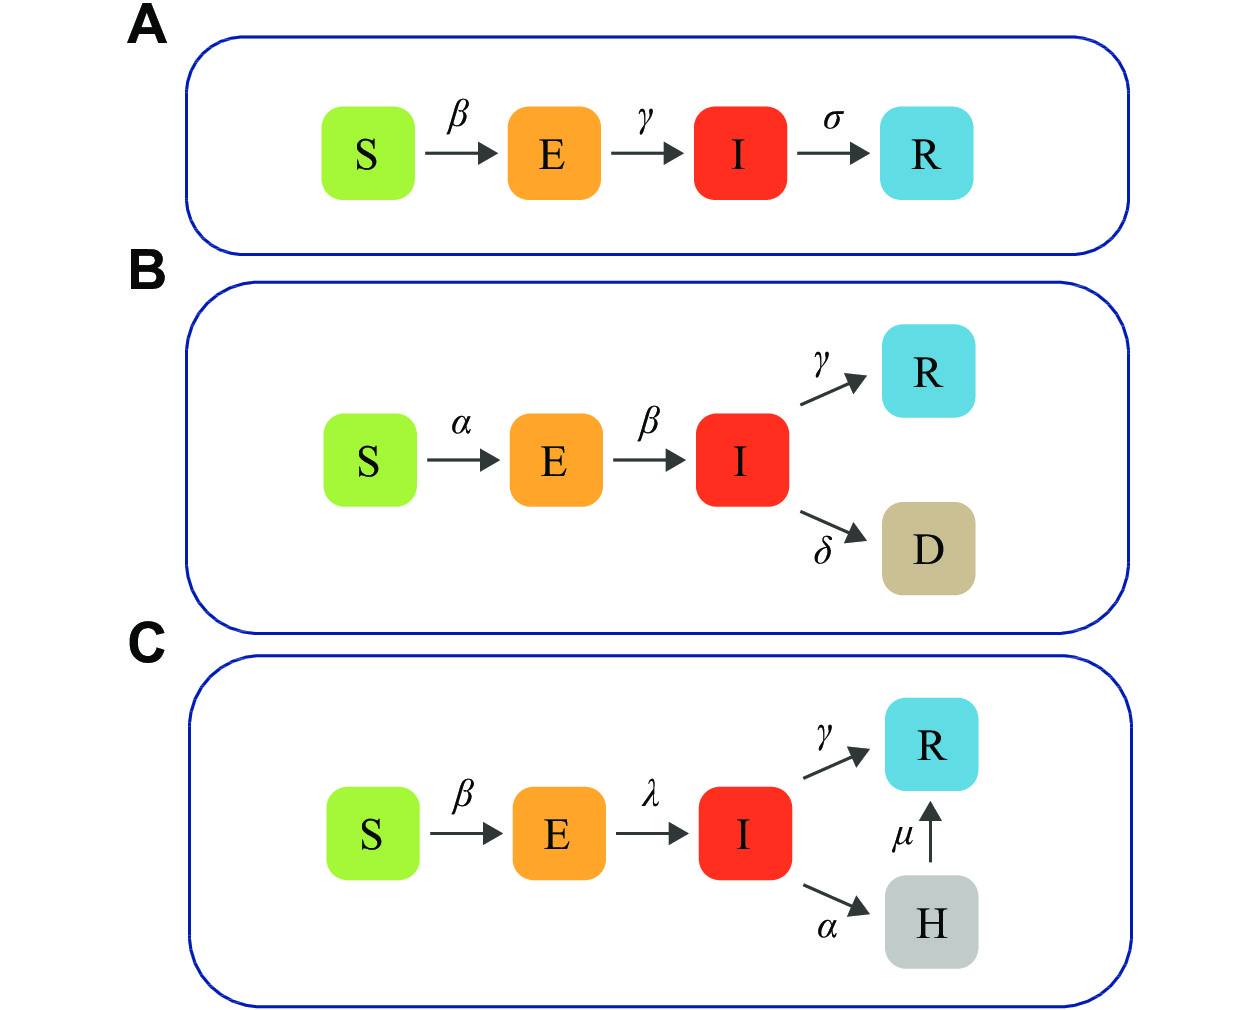
![]() Illustrations of the compartmental models.
Illustrations of the compartmental models.
-
![]() Population change curves of S, E, I, and R states of CM, SCM, ABM, and CAMM in scenario 1.
Population change curves of S, E, I, and R states of CM, SCM, ABM, and CAMM in scenario 1.
-
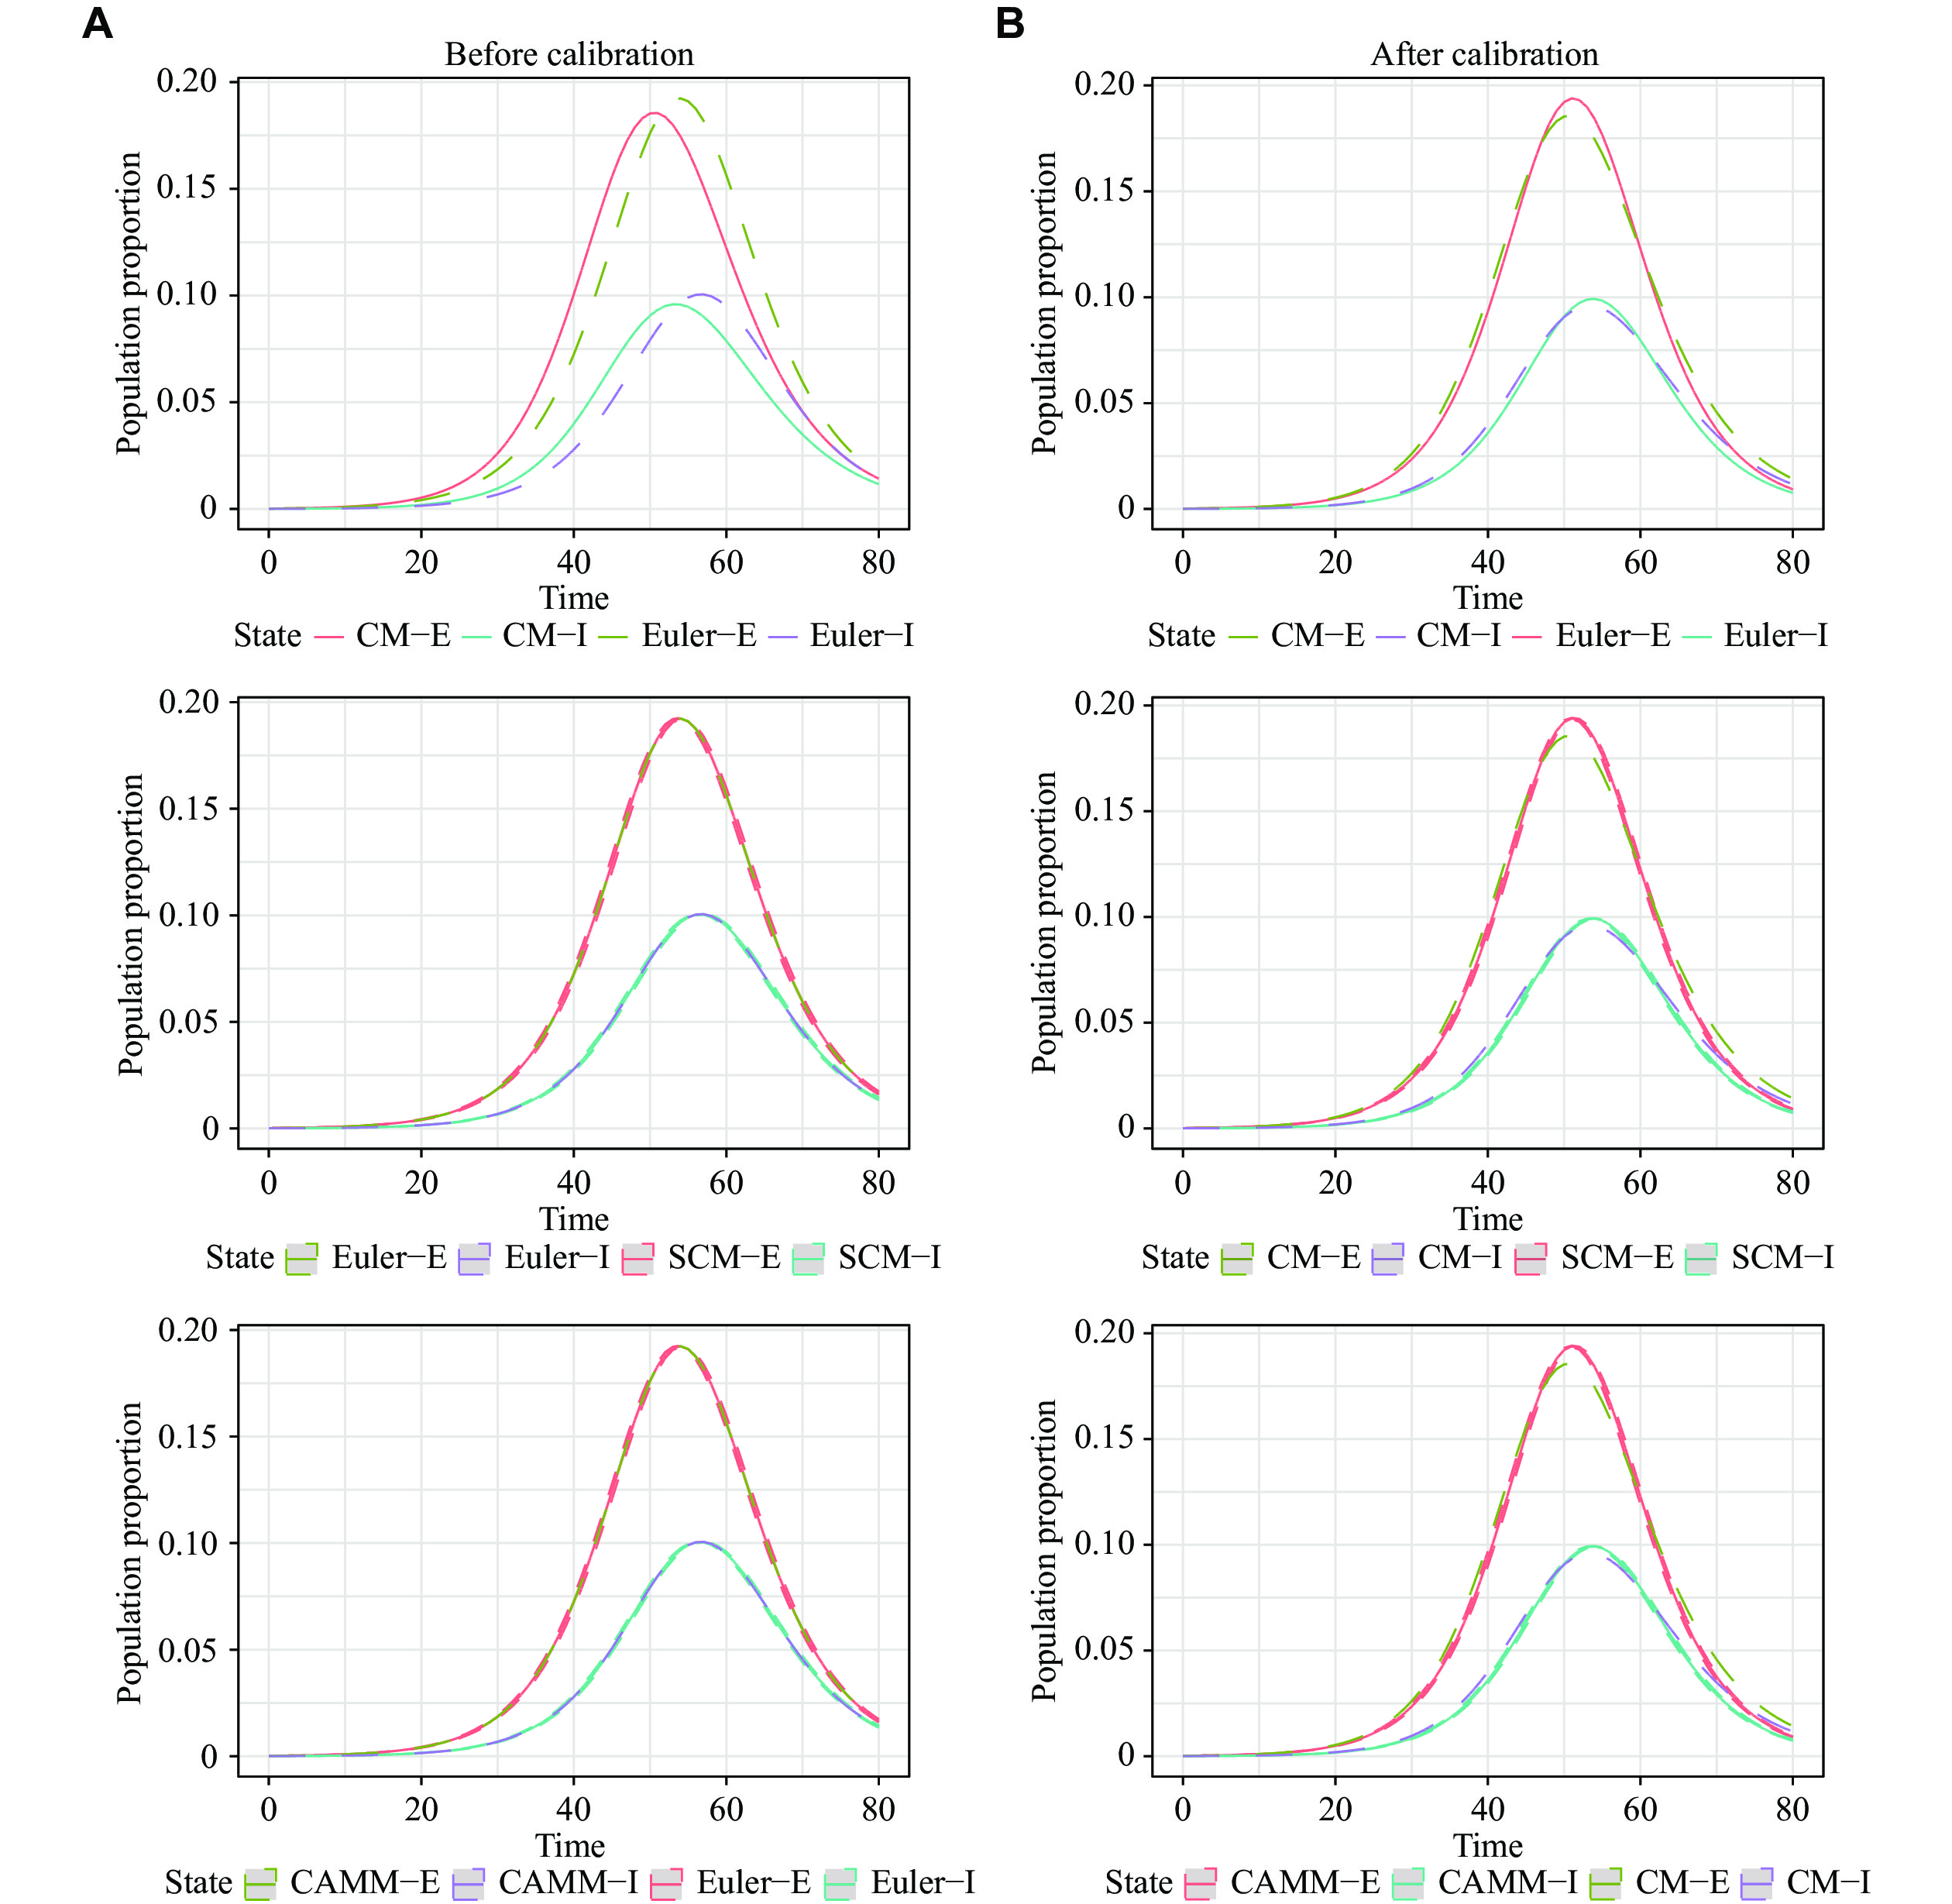
![]() Population change curves of E, and I states of CM, SCM, and CAMM in scenario 2.
Population change curves of E, and I states of CM, SCM, and CAMM in scenario 2.
-
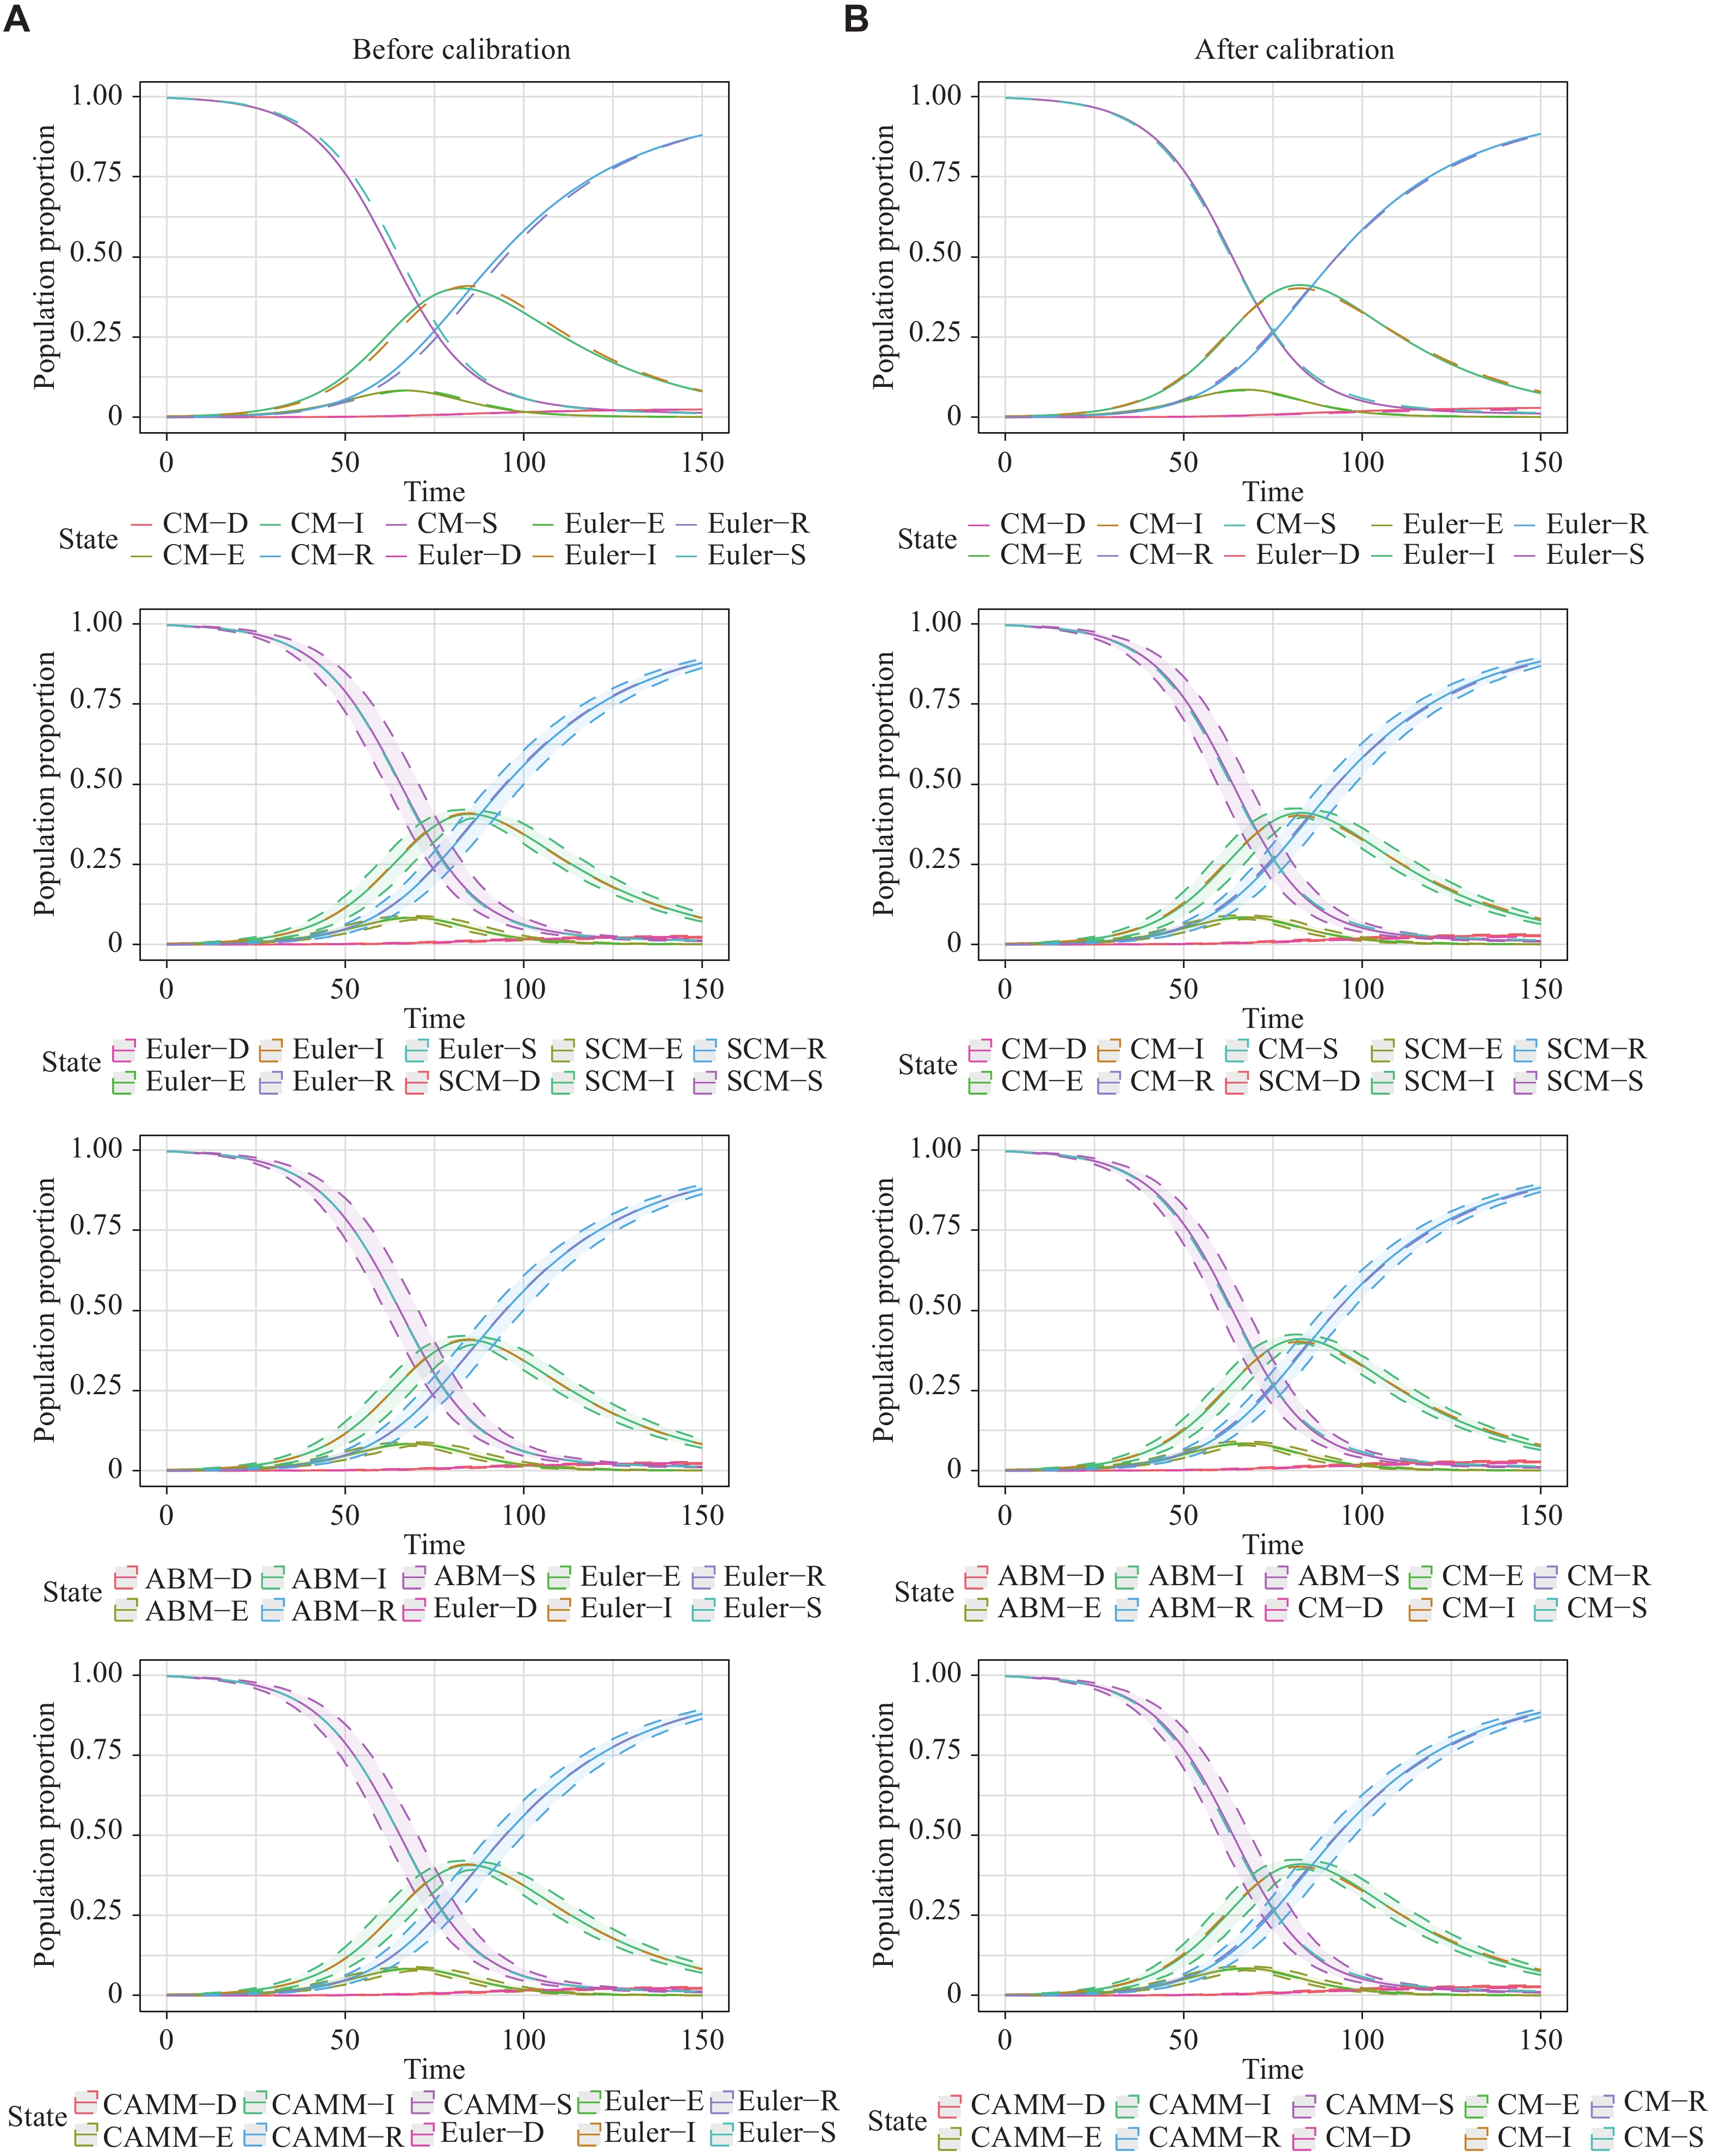
![]() Population change curves of S, E, I, R, and D states of CM, SCM, ABM, and CAMM in scenario 3.
Population change curves of S, E, I, R, and D states of CM, SCM, ABM, and CAMM in scenario 3.
-
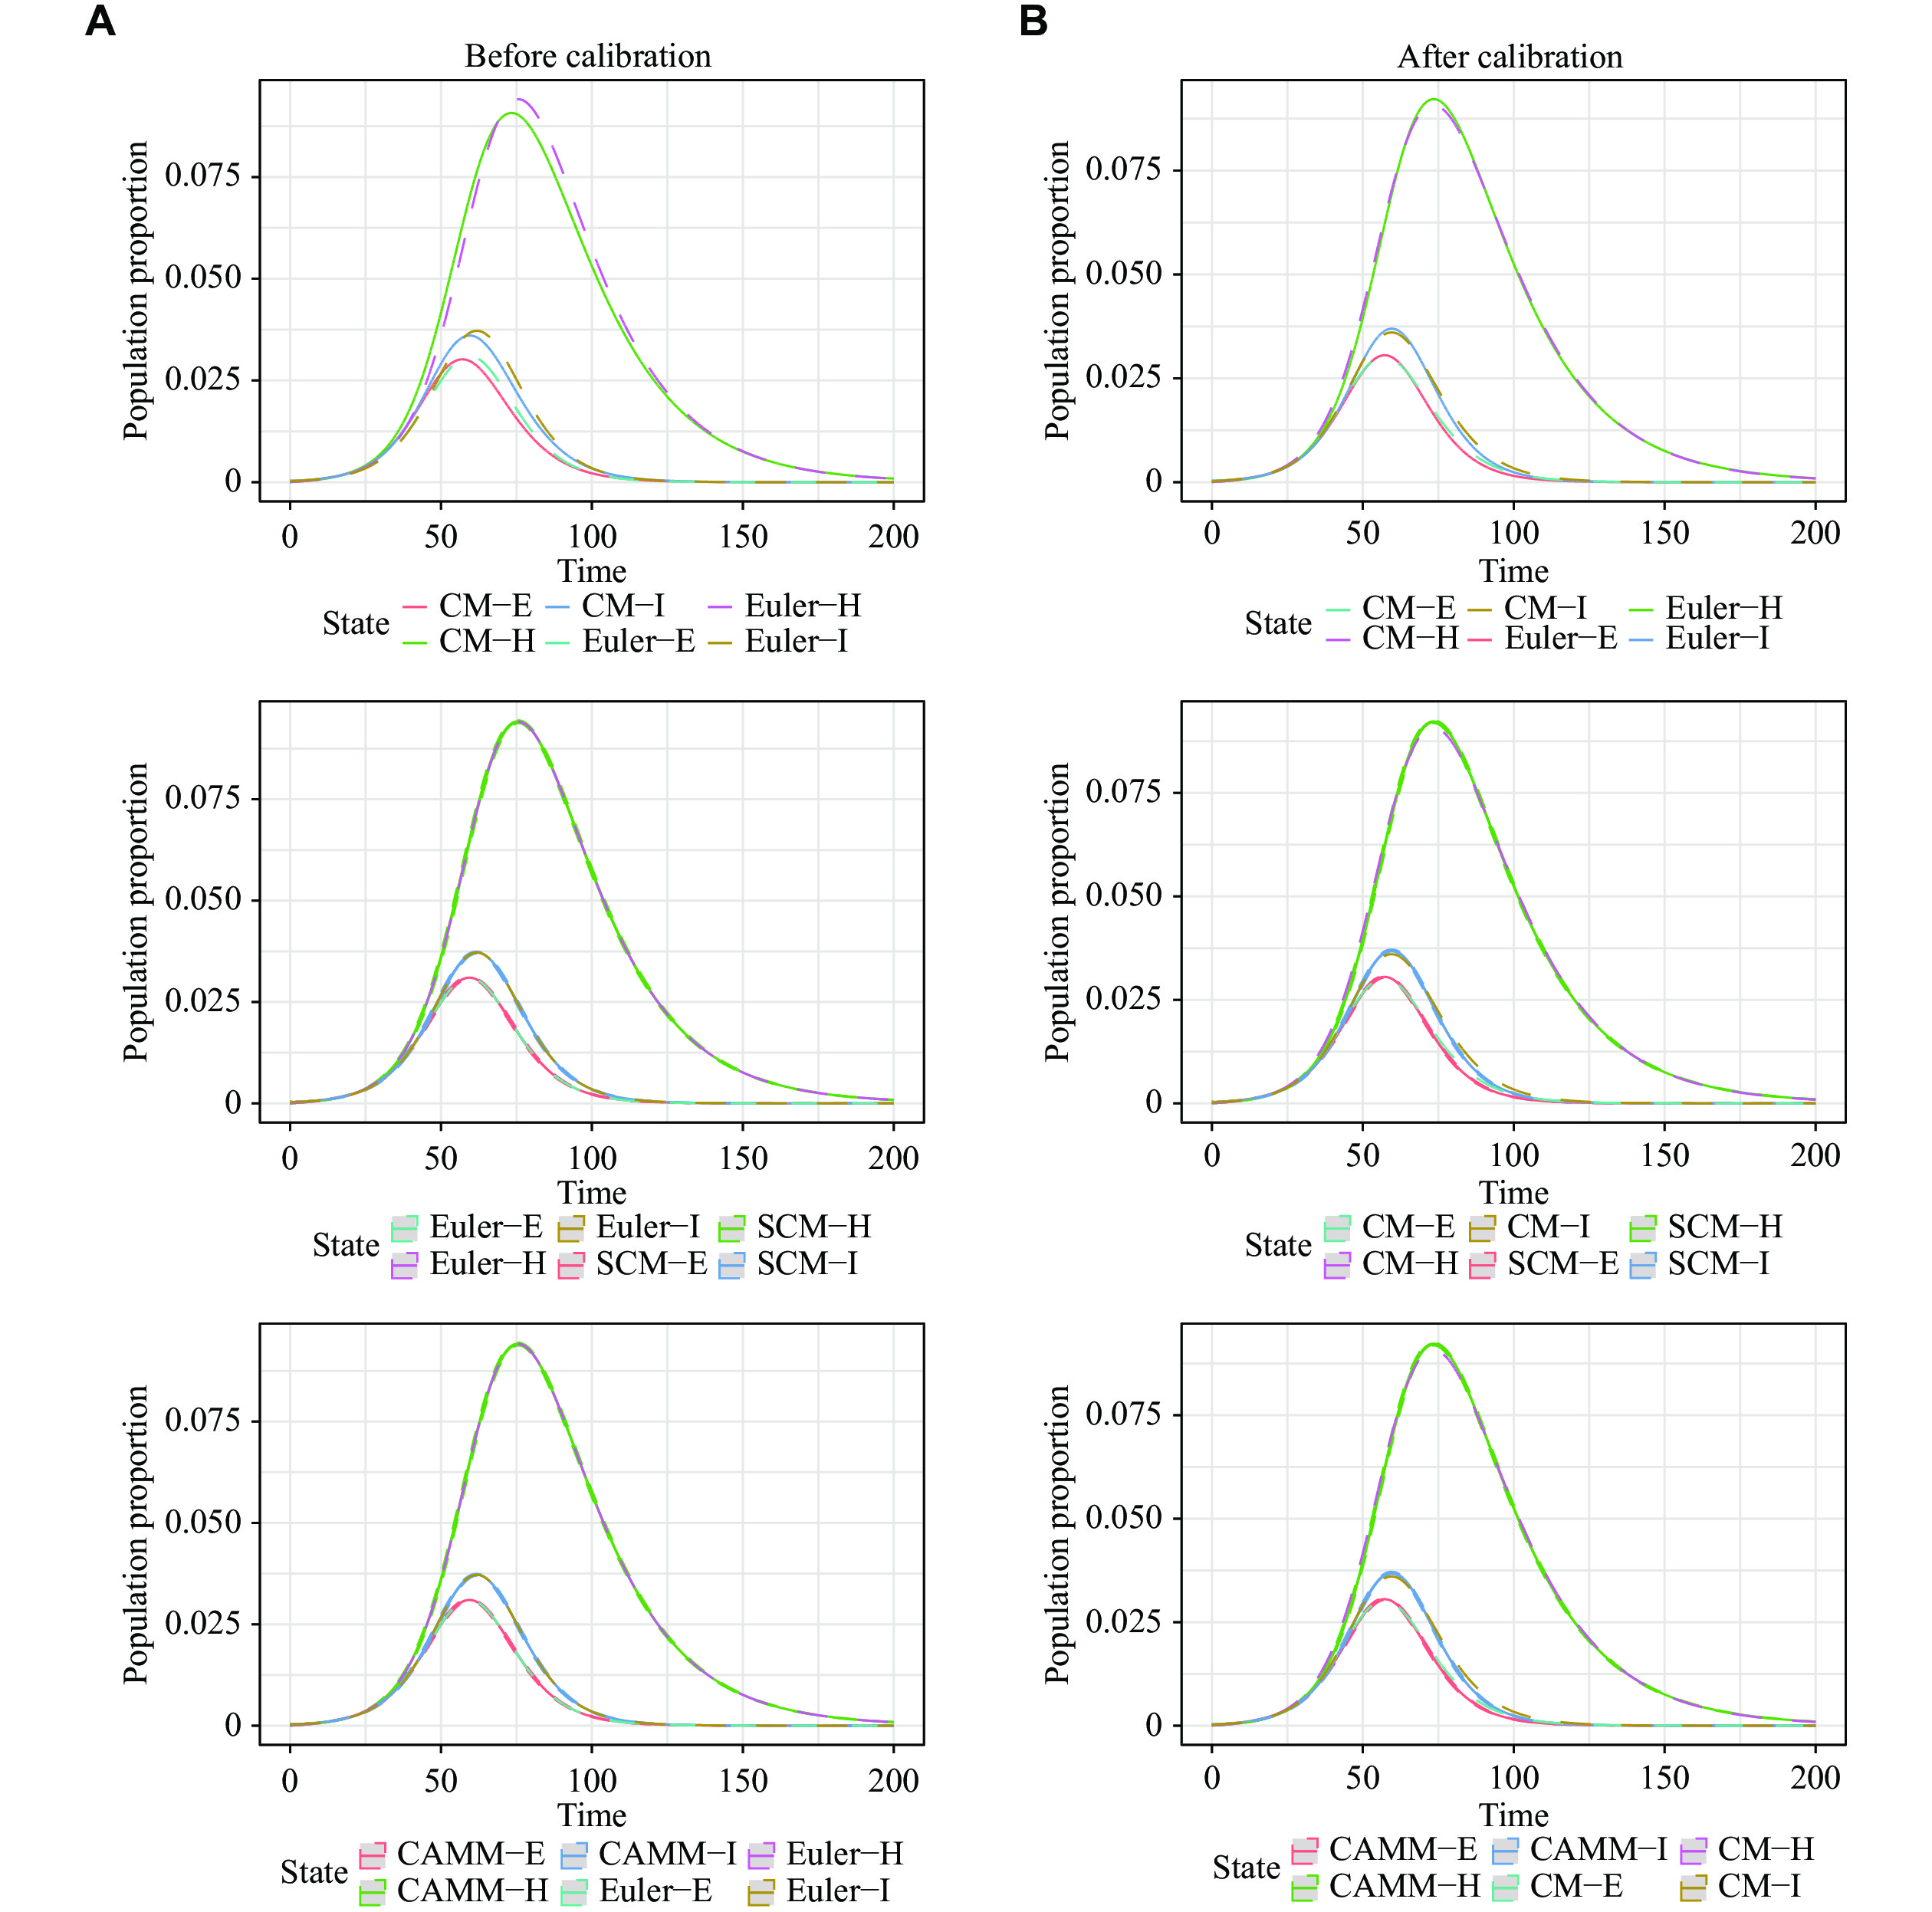
![]() Population change curves of E, I, and H states of CM, SCM, and CAMM in scenario 4.
Population change curves of E, I, and H states of CM, SCM, and CAMM in scenario 4.

Related articles
-
2022, 36(1): 32-38. DOI: 10.7555/JBR.35.20210083
-
2020, 34(6): 470-474. DOI: 10.7555/JBR.34.20200099
-
2020, 34(6): 458-469. DOI: 10.7555/JBR.34.20200044
-
2020, 34(6): 437-445. DOI: 10.7555/JBR.34.20200129
-
2020, 34(6): 431-436. DOI: 10.7555/JBR.34.20200110
-
2020, 34(6): 422-430. DOI: 10.7555/JBR.34.20200119
-
2020, 34(6): 416-421. DOI: 10.7555/JBR.34.20200118
-
2020, 34(6): 410-415. DOI: 10.7555/JBR.34.20200134
-
2020, 34(6): 397-409. DOI: 10.7555/JBR.34.20200112
-
2020, 34(6): 395-396. DOI: 10.7555/JBR.34.20200701
