Authors and Reviewers

 Download:
Population change curves of S, E, I, and R states of CM, SCM, ABM, and CAMM in scenario 1.
Figures of the Article
-
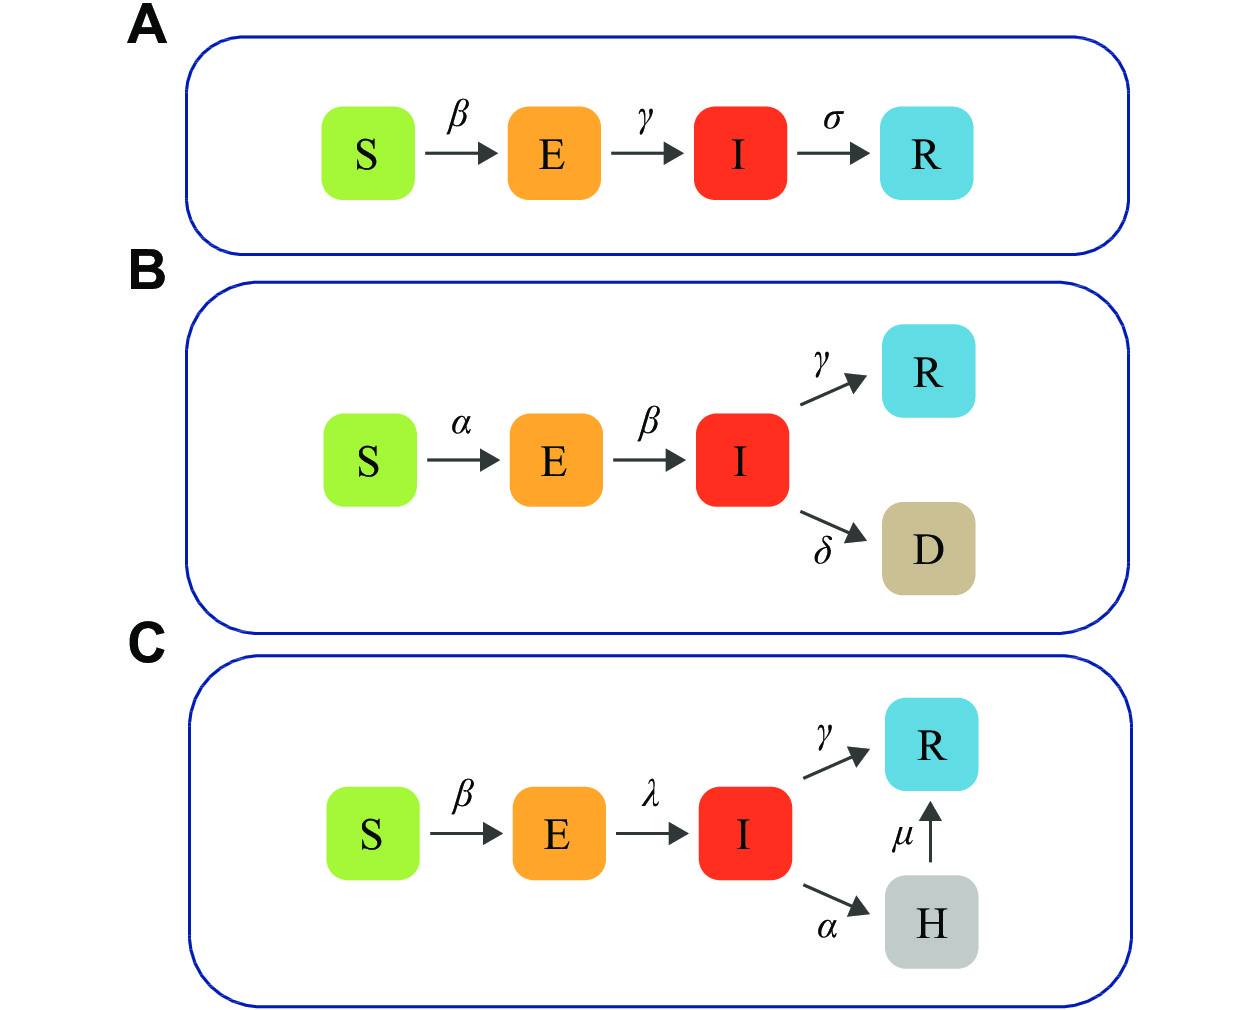
![]() Illustrations of the compartmental models.
Illustrations of the compartmental models.
-
![]() Population change curves of S, E, I, and R states of CM, SCM, ABM, and CAMM in scenario 1.
Population change curves of S, E, I, and R states of CM, SCM, ABM, and CAMM in scenario 1.
-
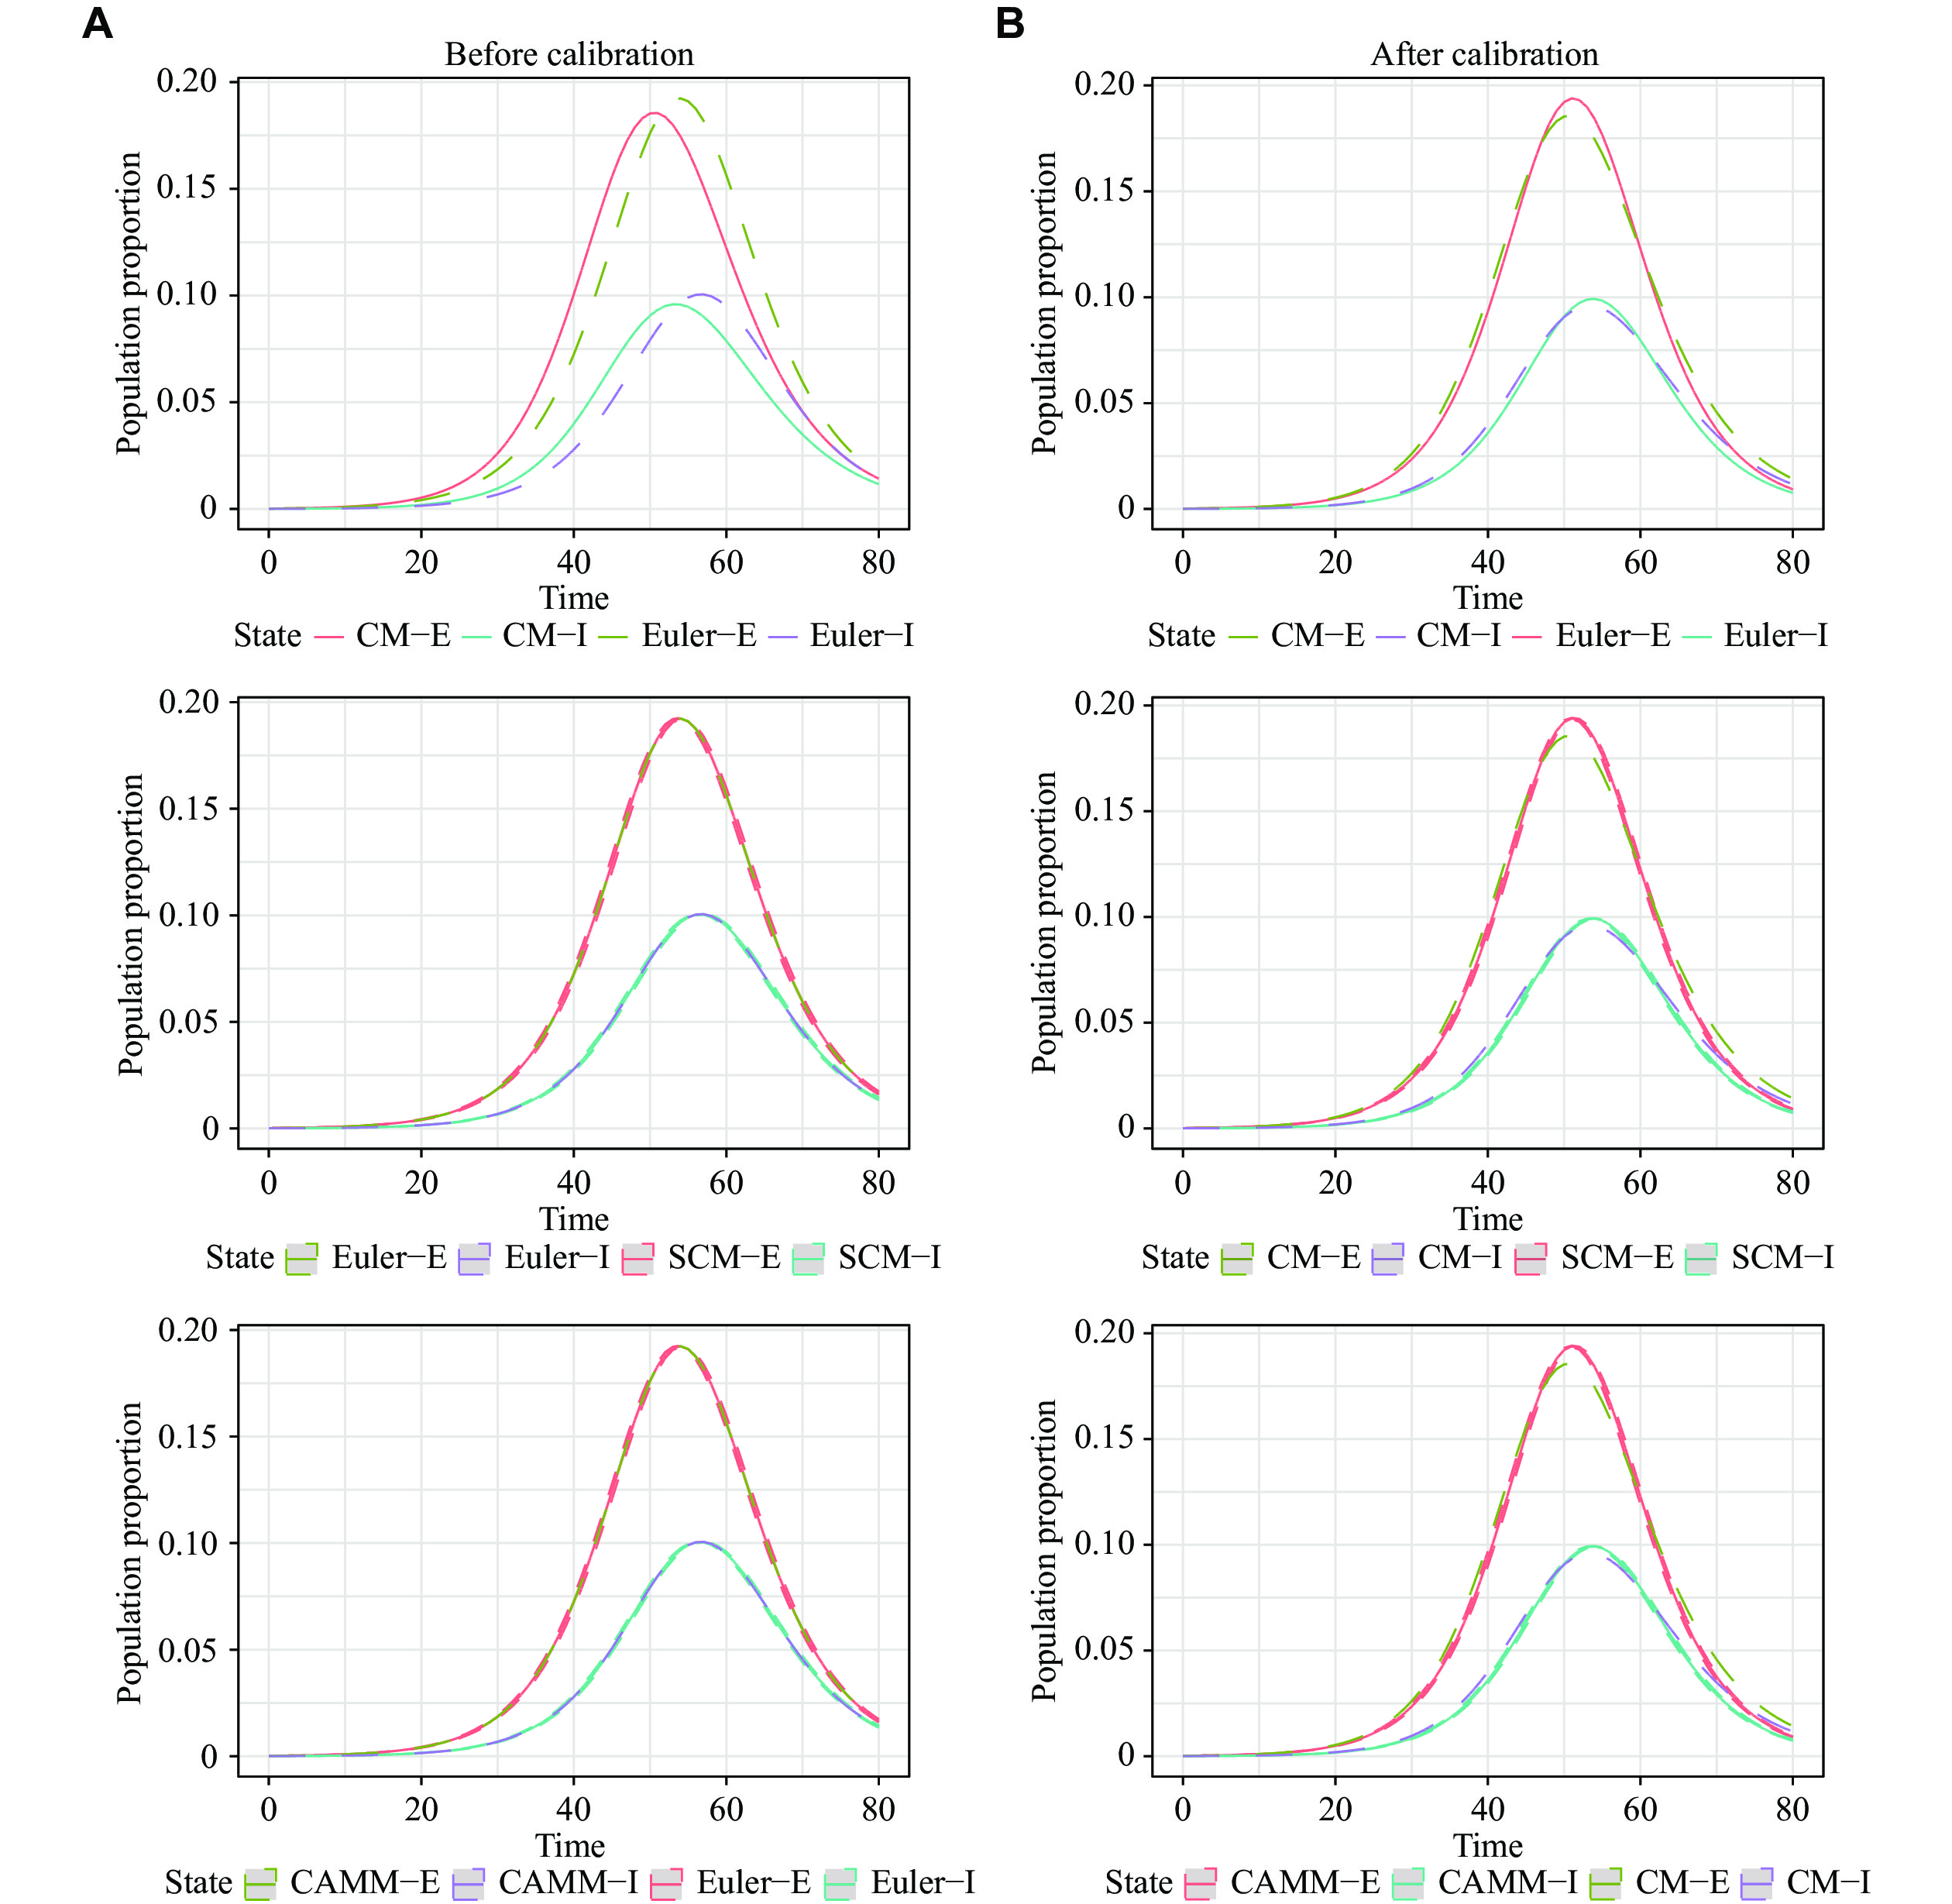
![]() Population change curves of E, and I states of CM, SCM, and CAMM in scenario 2.
Population change curves of E, and I states of CM, SCM, and CAMM in scenario 2.
-
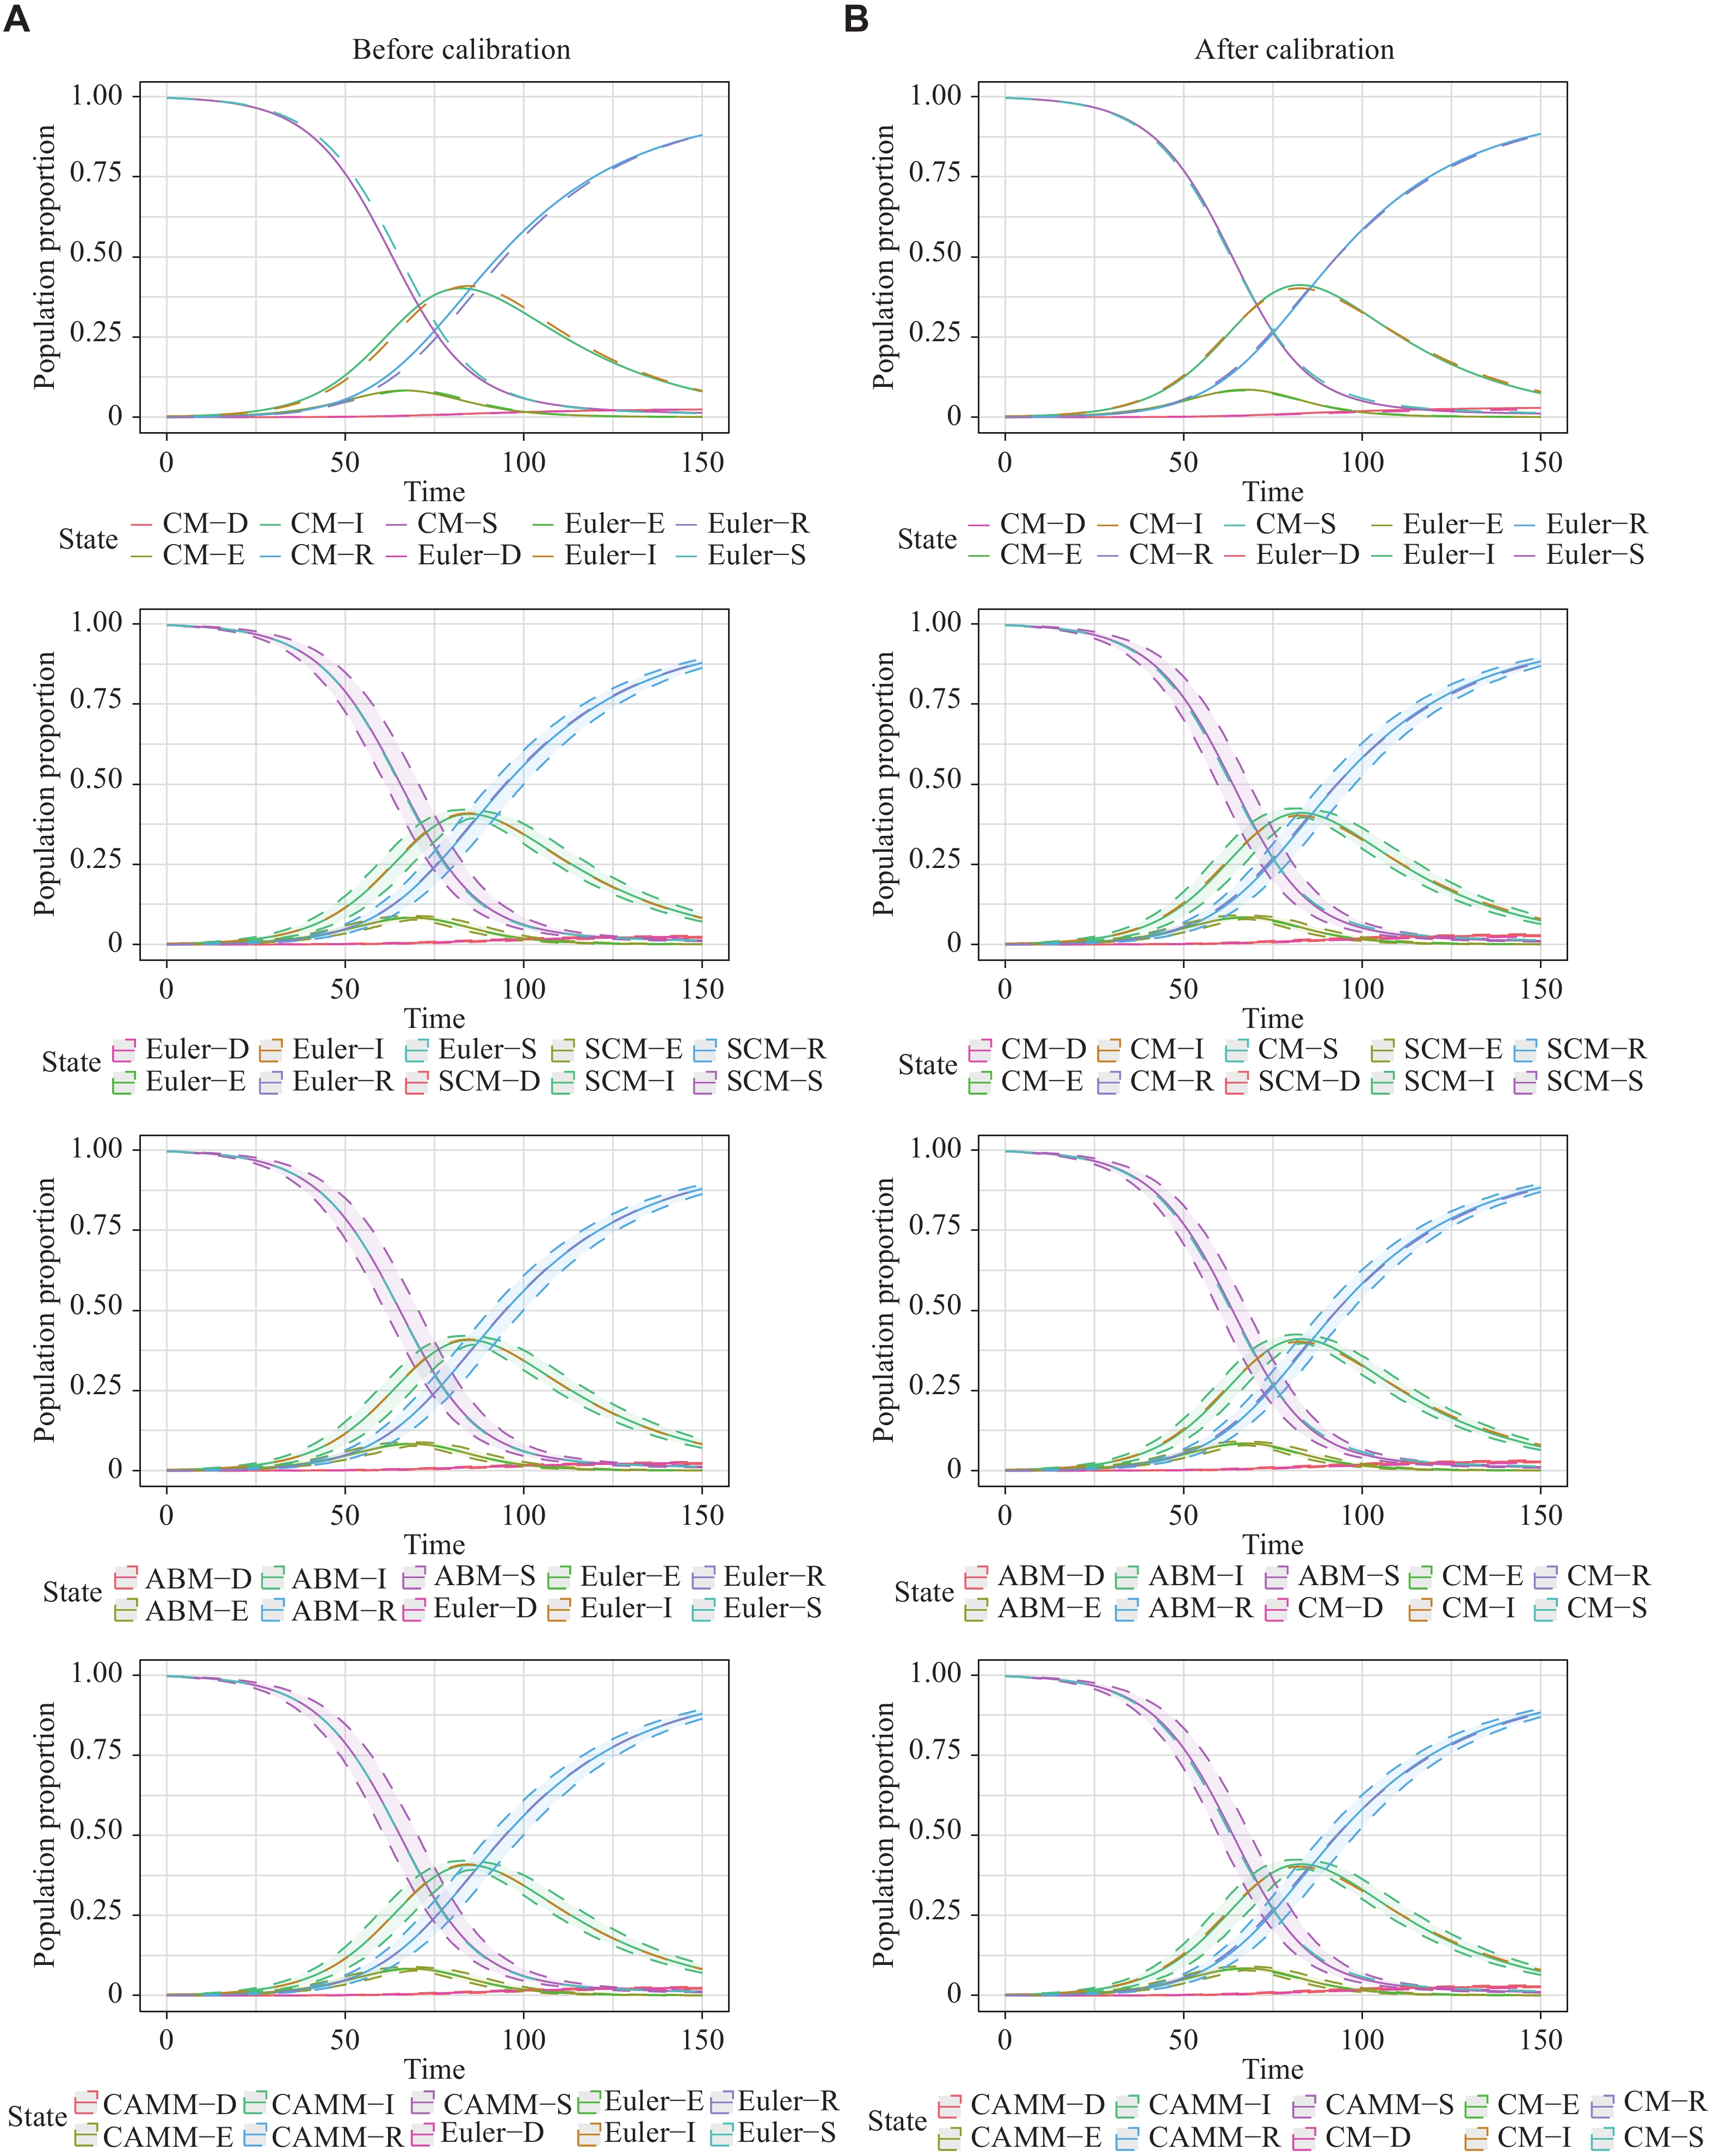
![]() Population change curves of S, E, I, R, and D states of CM, SCM, ABM, and CAMM in scenario 3.
Population change curves of S, E, I, R, and D states of CM, SCM, ABM, and CAMM in scenario 3.
-
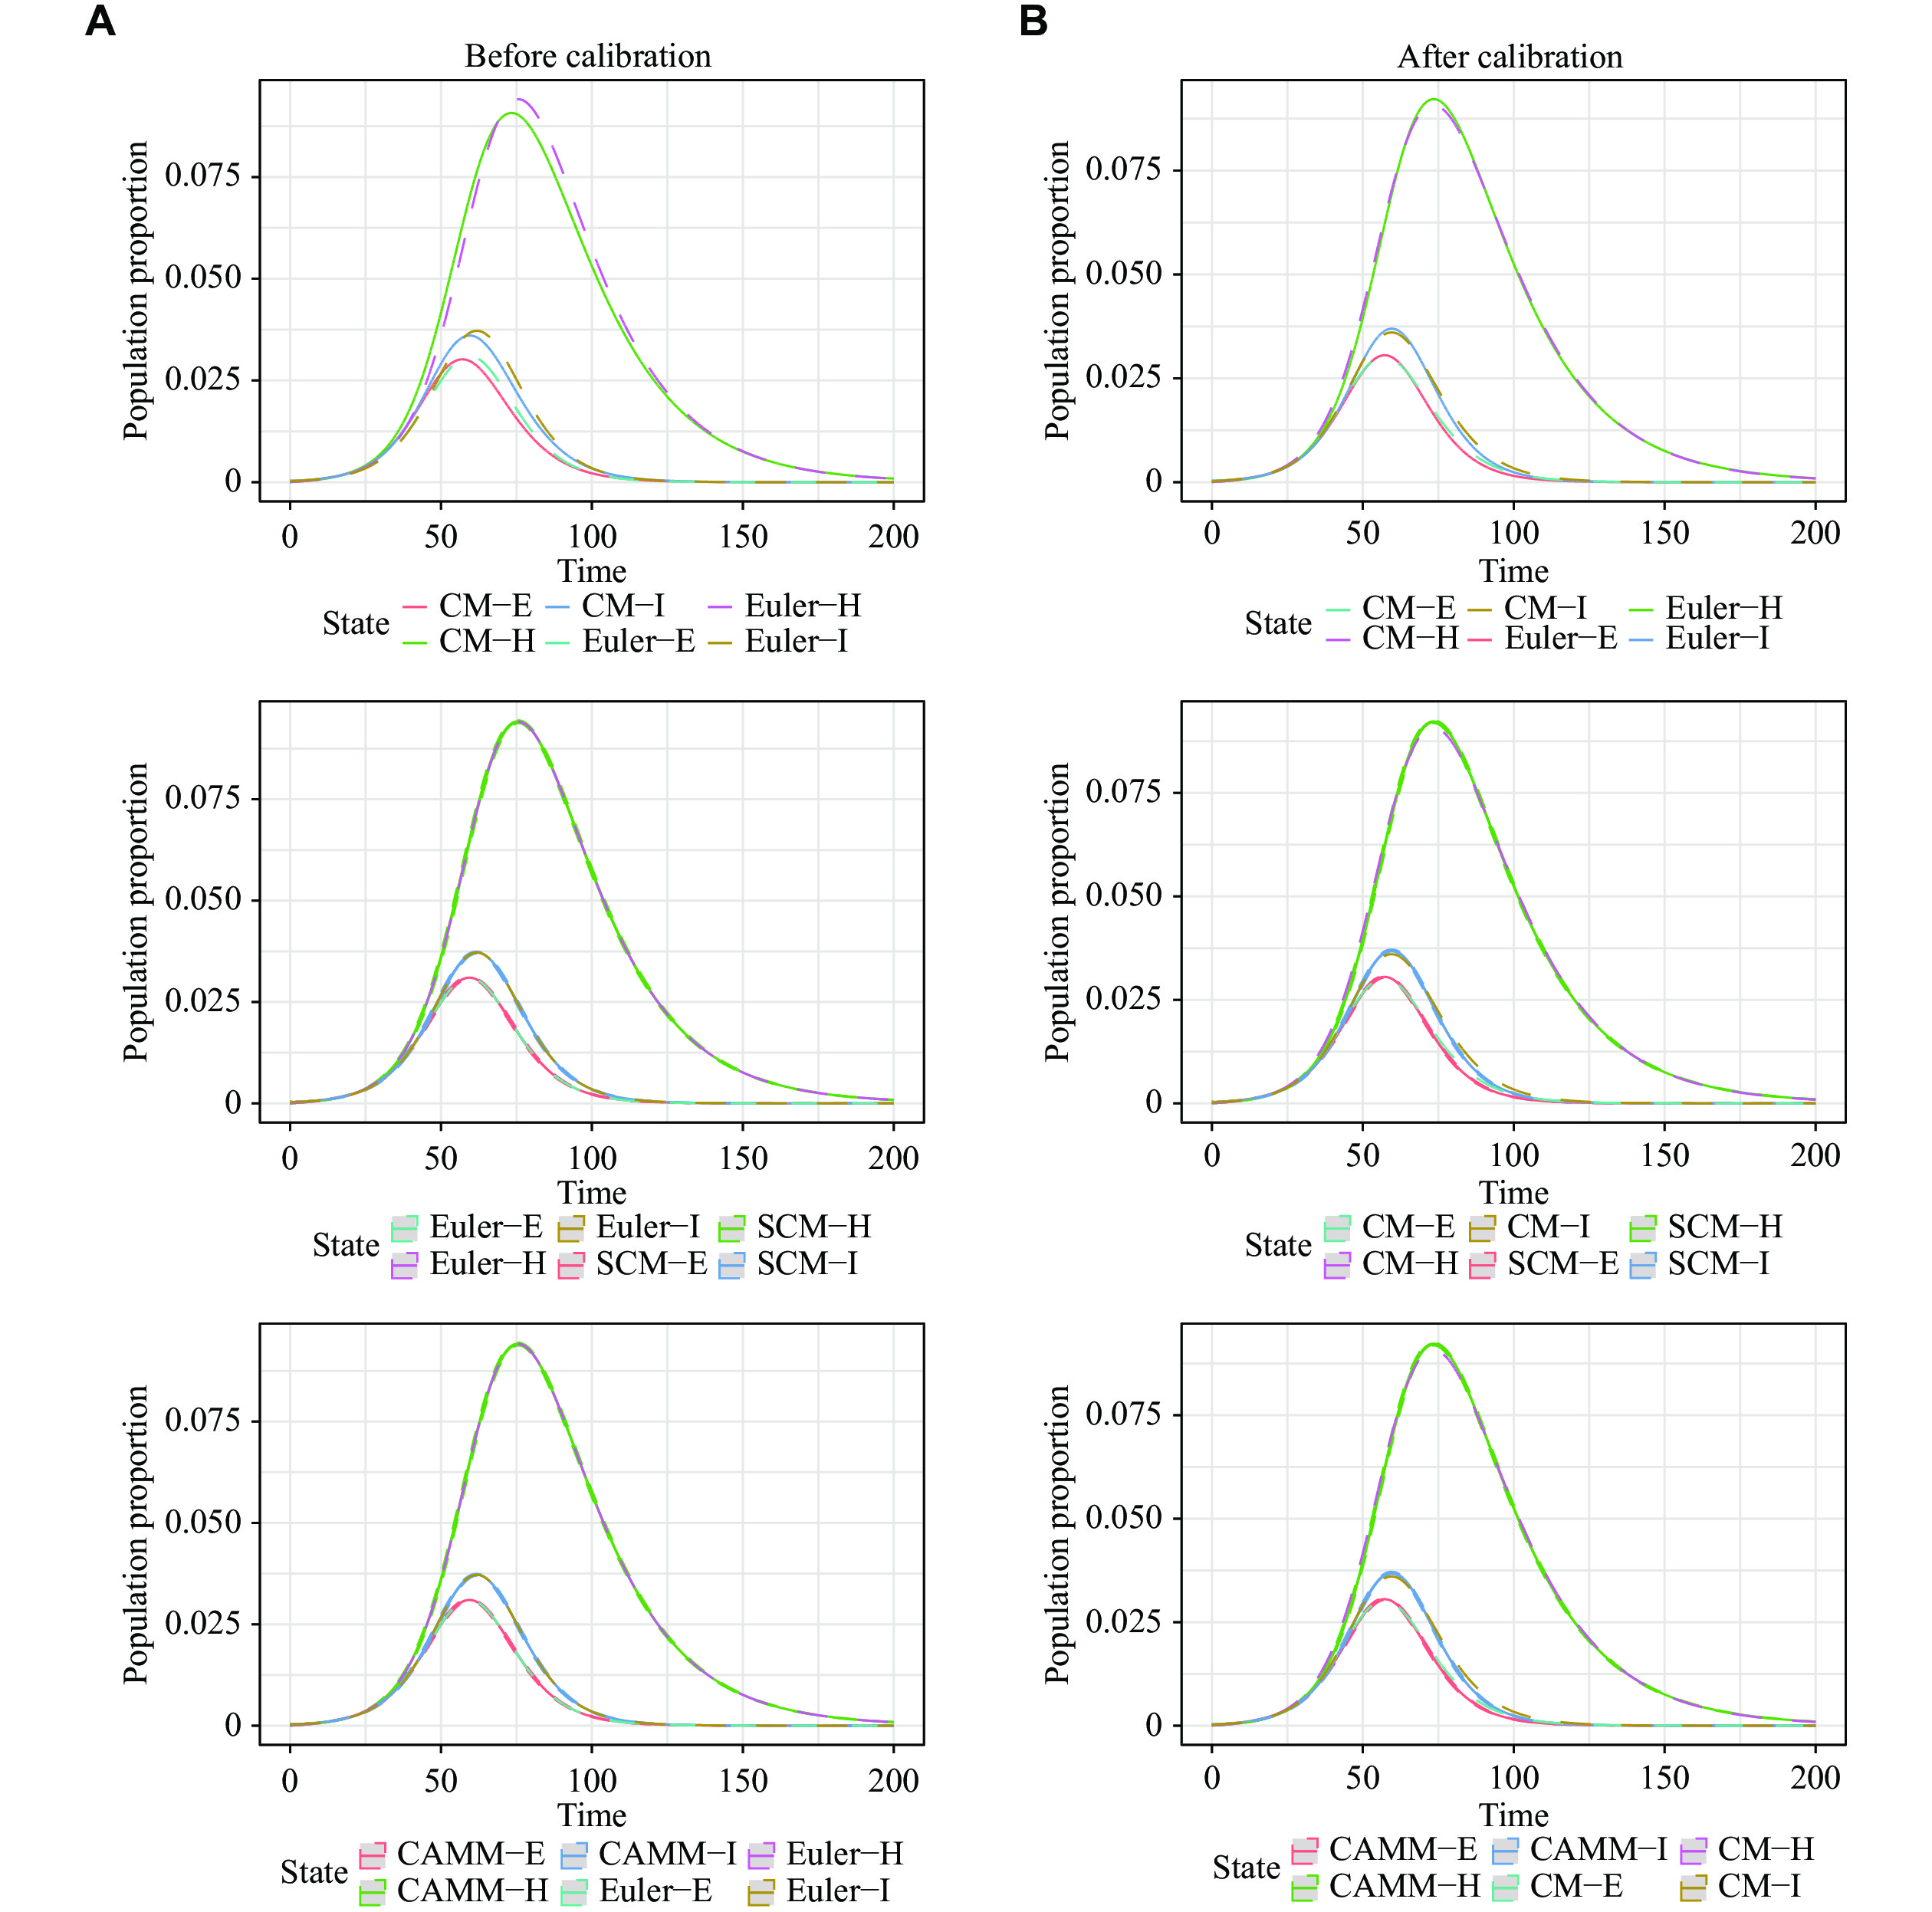
![]() Population change curves of E, I, and H states of CM, SCM, and CAMM in scenario 4.
Population change curves of E, I, and H states of CM, SCM, and CAMM in scenario 4.