 Authors and Reviewers
Figures of the Article
-
![]() Single cell transcriptional profiling of BALF cells.
Single cell transcriptional profiling of BALF cells.
-
![]() Comparisons of the proportions of the 8 different BALF cell types between healthy controls and tuberculosis patients.
Comparisons of the proportions of the 8 different BALF cell types between healthy controls and tuberculosis patients.
-
![]() Different subclusters of alveolar macrophages identified in BALF cells.
Different subclusters of alveolar macrophages identified in BALF cells.
-
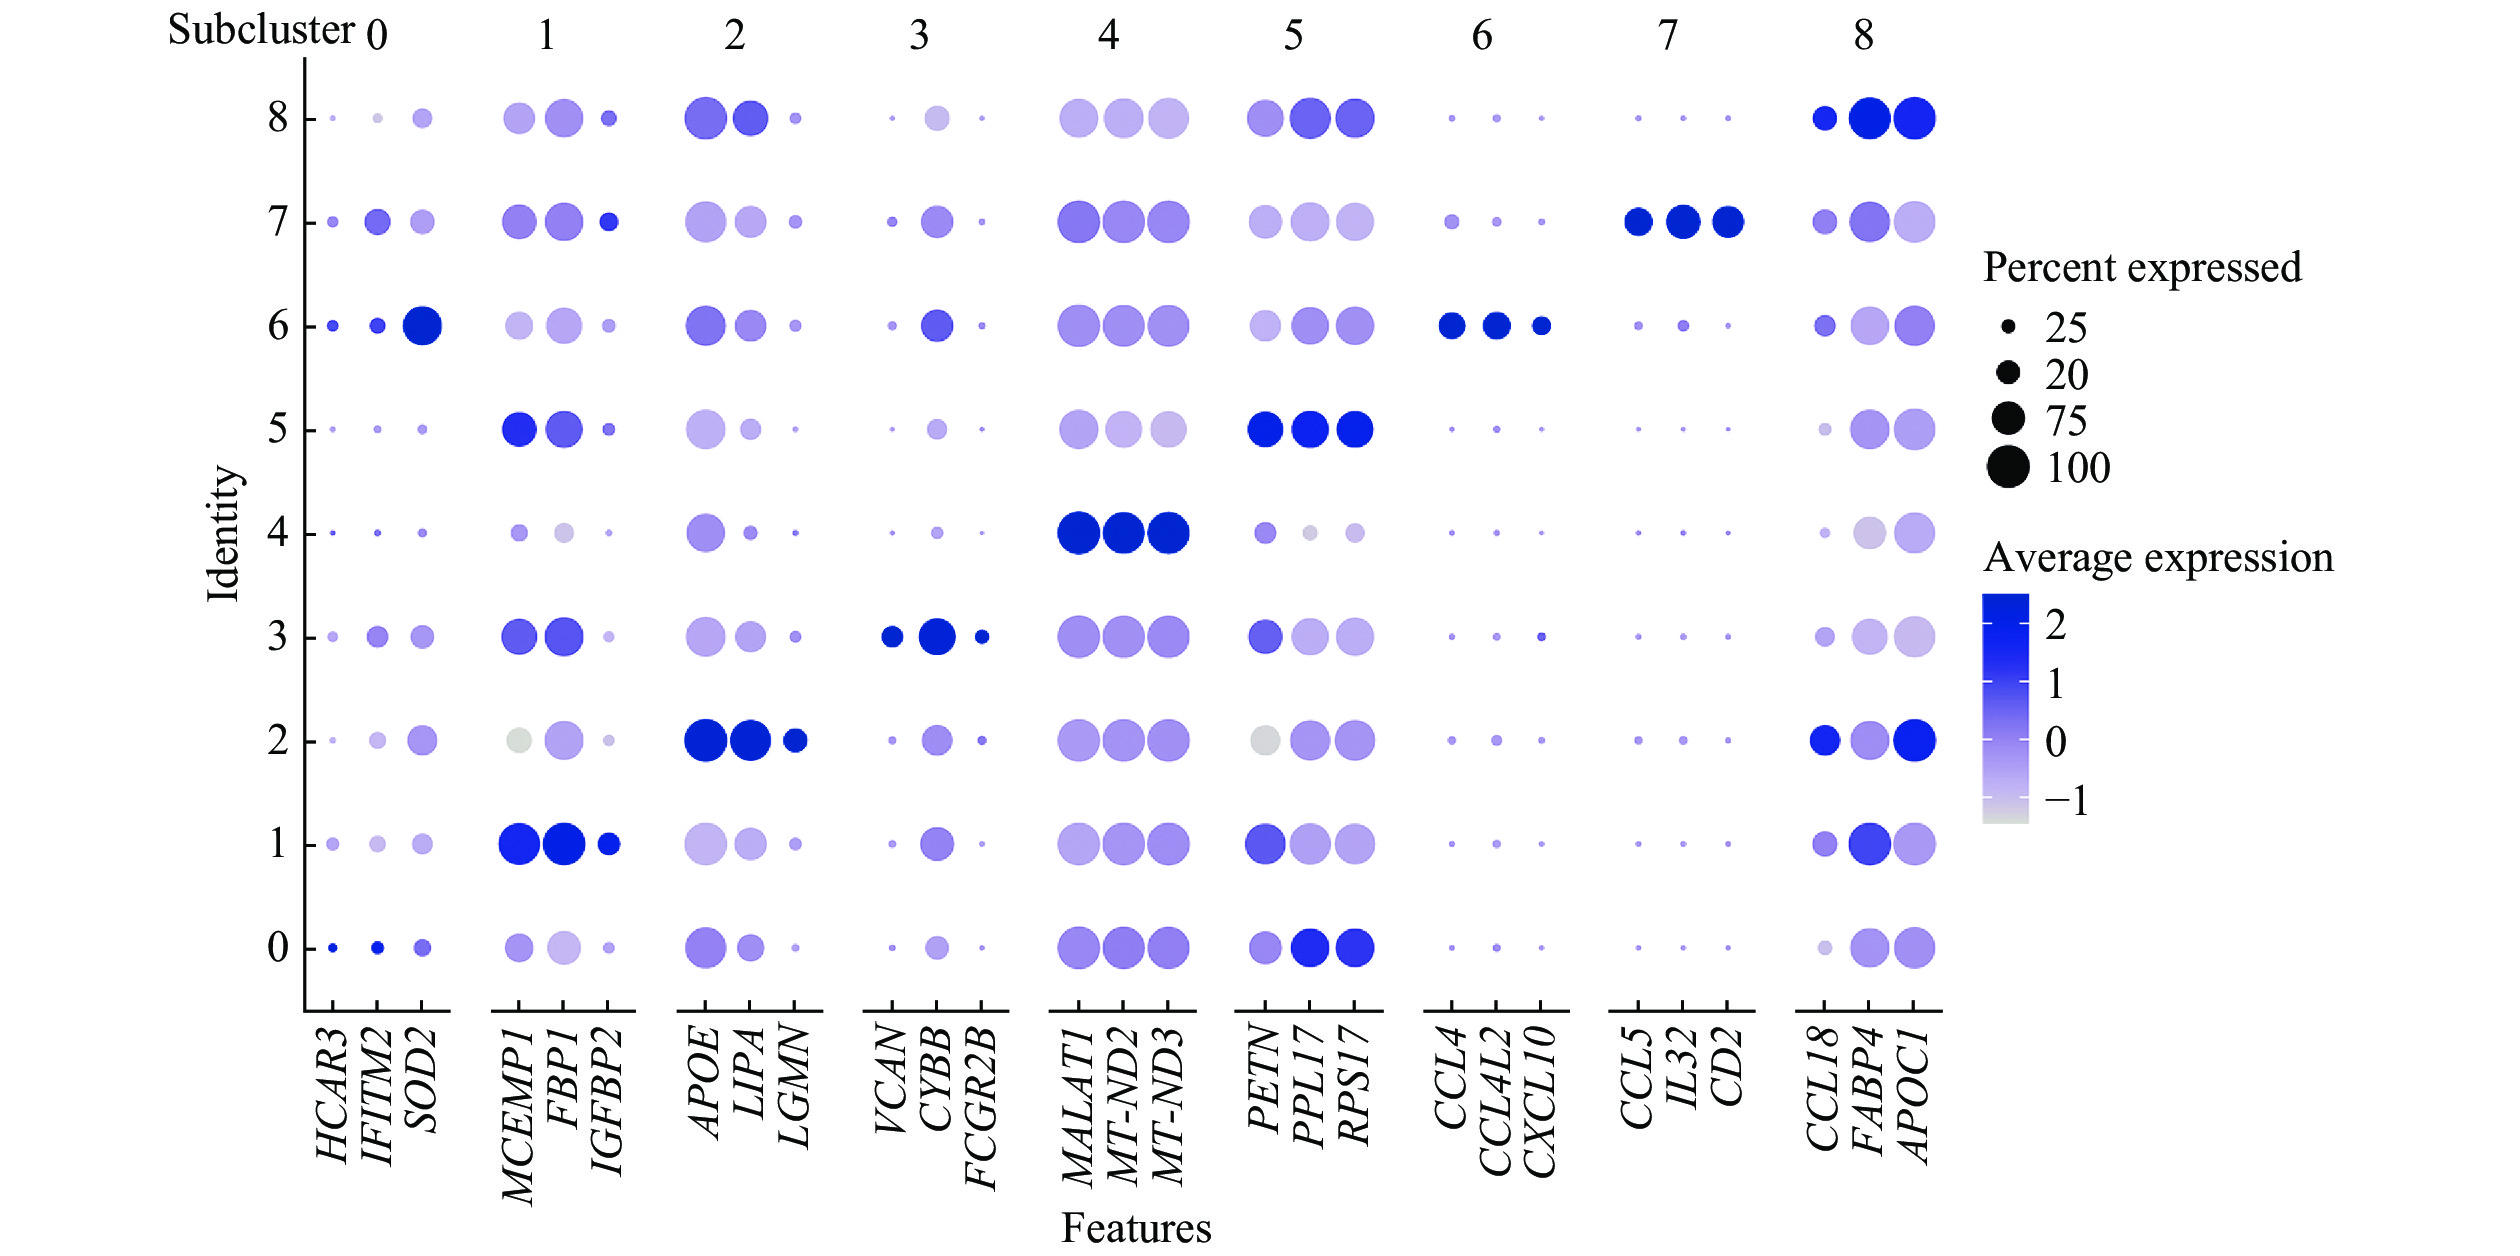
![]() Dot plot showing the expression of the top 3 marker genes in each macrophage subcluster across all 9 macrophage subclusters.
Dot plot showing the expression of the top 3 marker genes in each macrophage subcluster across all 9 macrophage subclusters.
-
![]() Functional enrichment analysis of macrophage subclusters that increased in active tuberculosis patients (subclusters 1–3, 6, and 7) with the upregulated differentially expressed genes.
Functional enrichment analysis of macrophage subclusters that increased in active tuberculosis patients (subclusters 1–3, 6, and 7) with the upregulated differentially expressed genes.
-
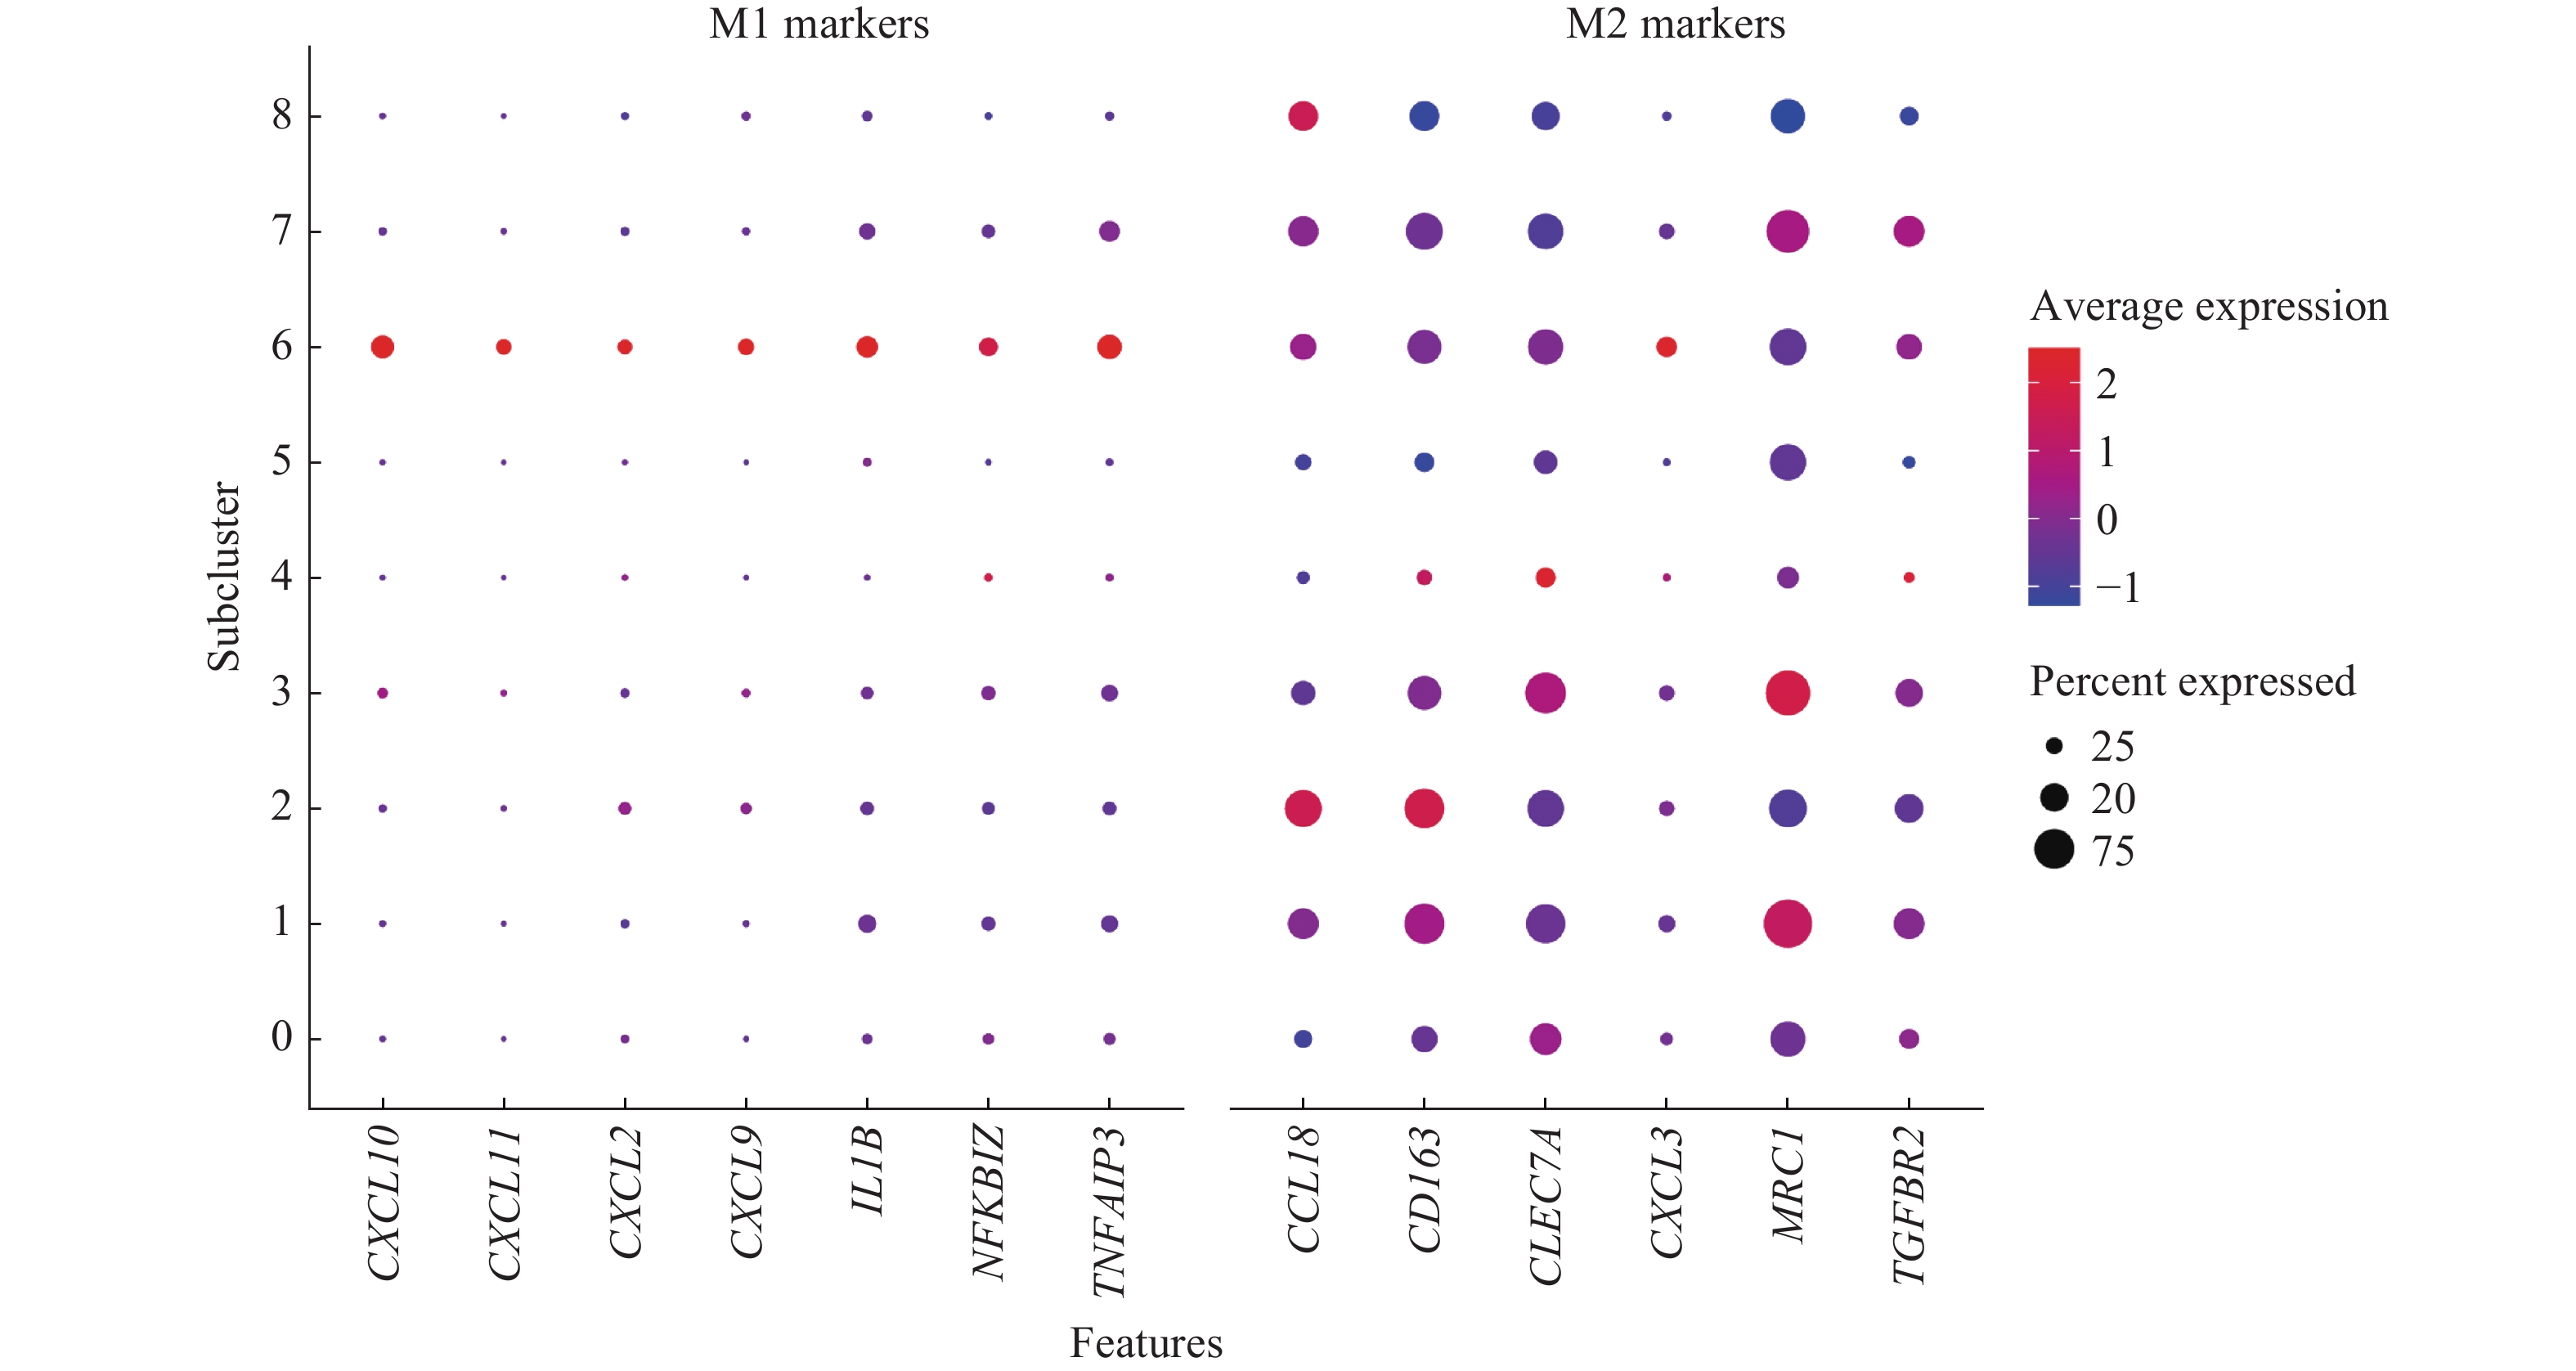
![]() Dot plot of M1-like and M2-like macrophage gene markers expression across the 9 macrophage subclusters.
Dot plot of M1-like and M2-like macrophage gene markers expression across the 9 macrophage subclusters.
-
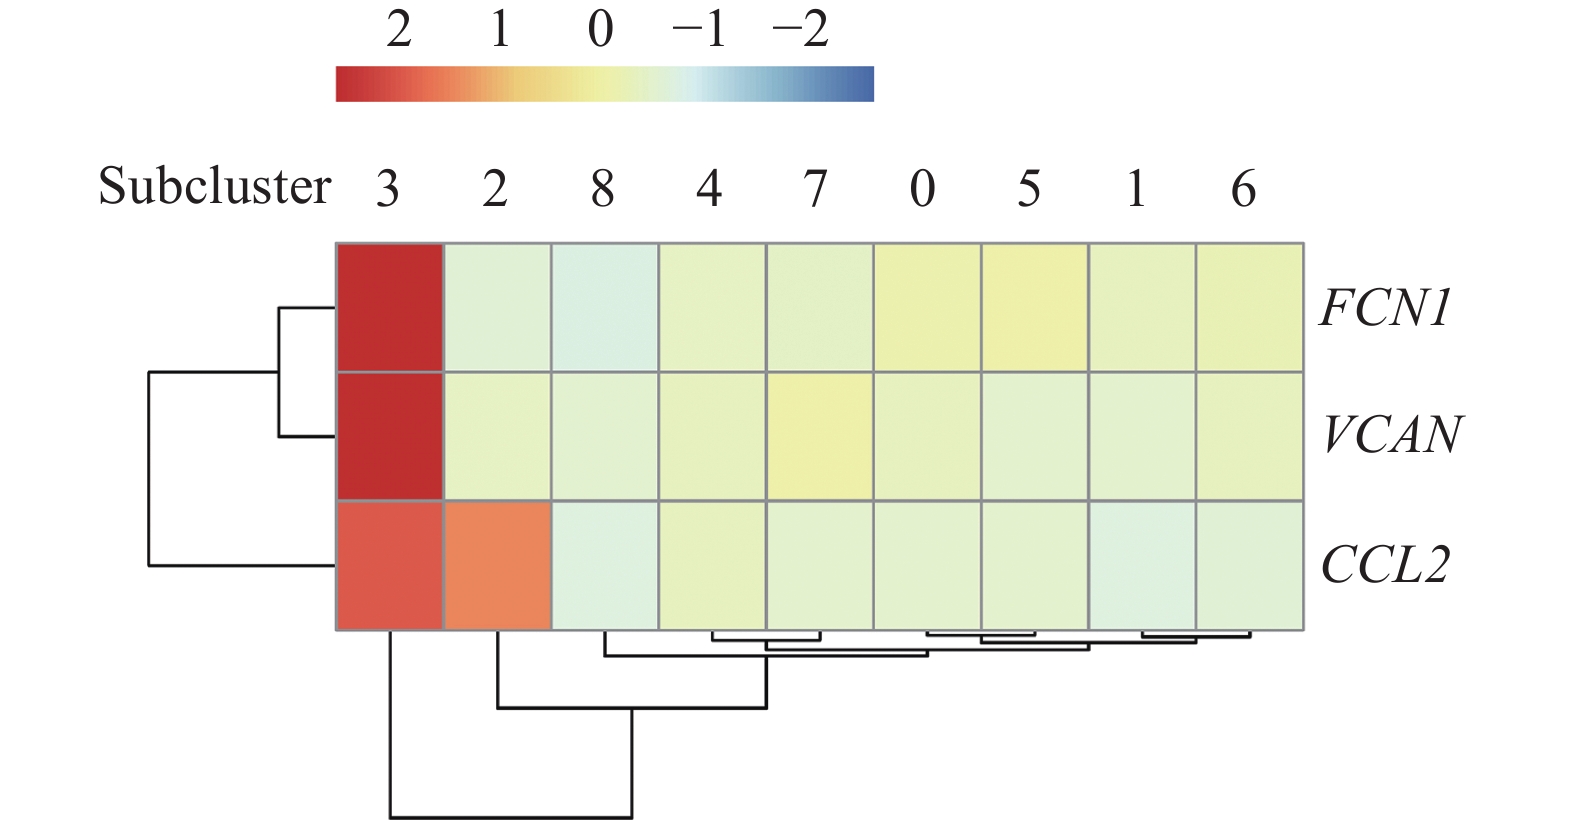
![]() Expression of the monocyte-like macrophage gene markers across the 9 macrophage subclusters.
Expression of the monocyte-like macrophage gene markers across the 9 macrophage subclusters.
-
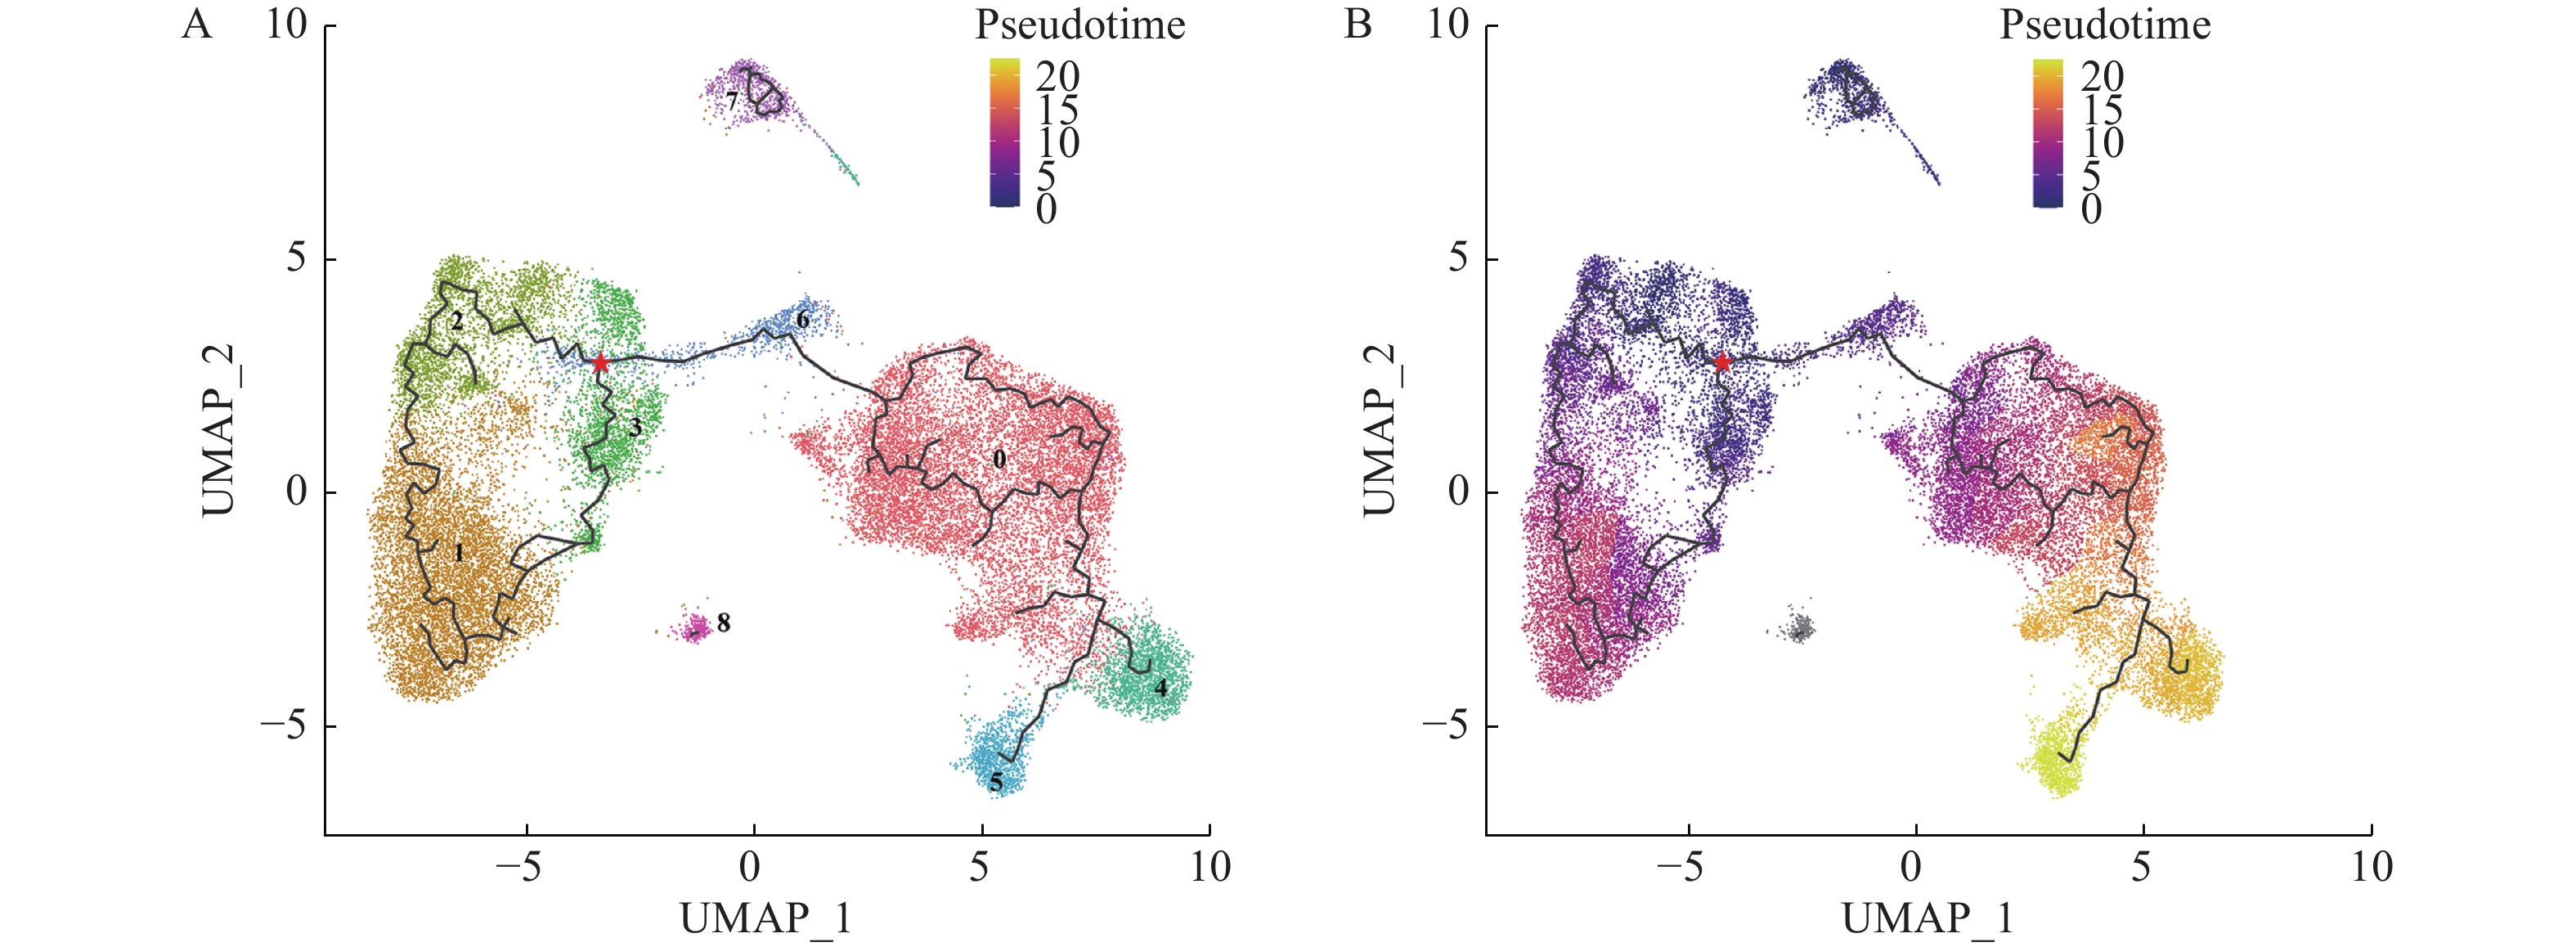
![]() UMAP plot of different macrophage subclusters colored by pseudo-temporal trajectory analysis.
UMAP plot of different macrophage subclusters colored by pseudo-temporal trajectory analysis.
-
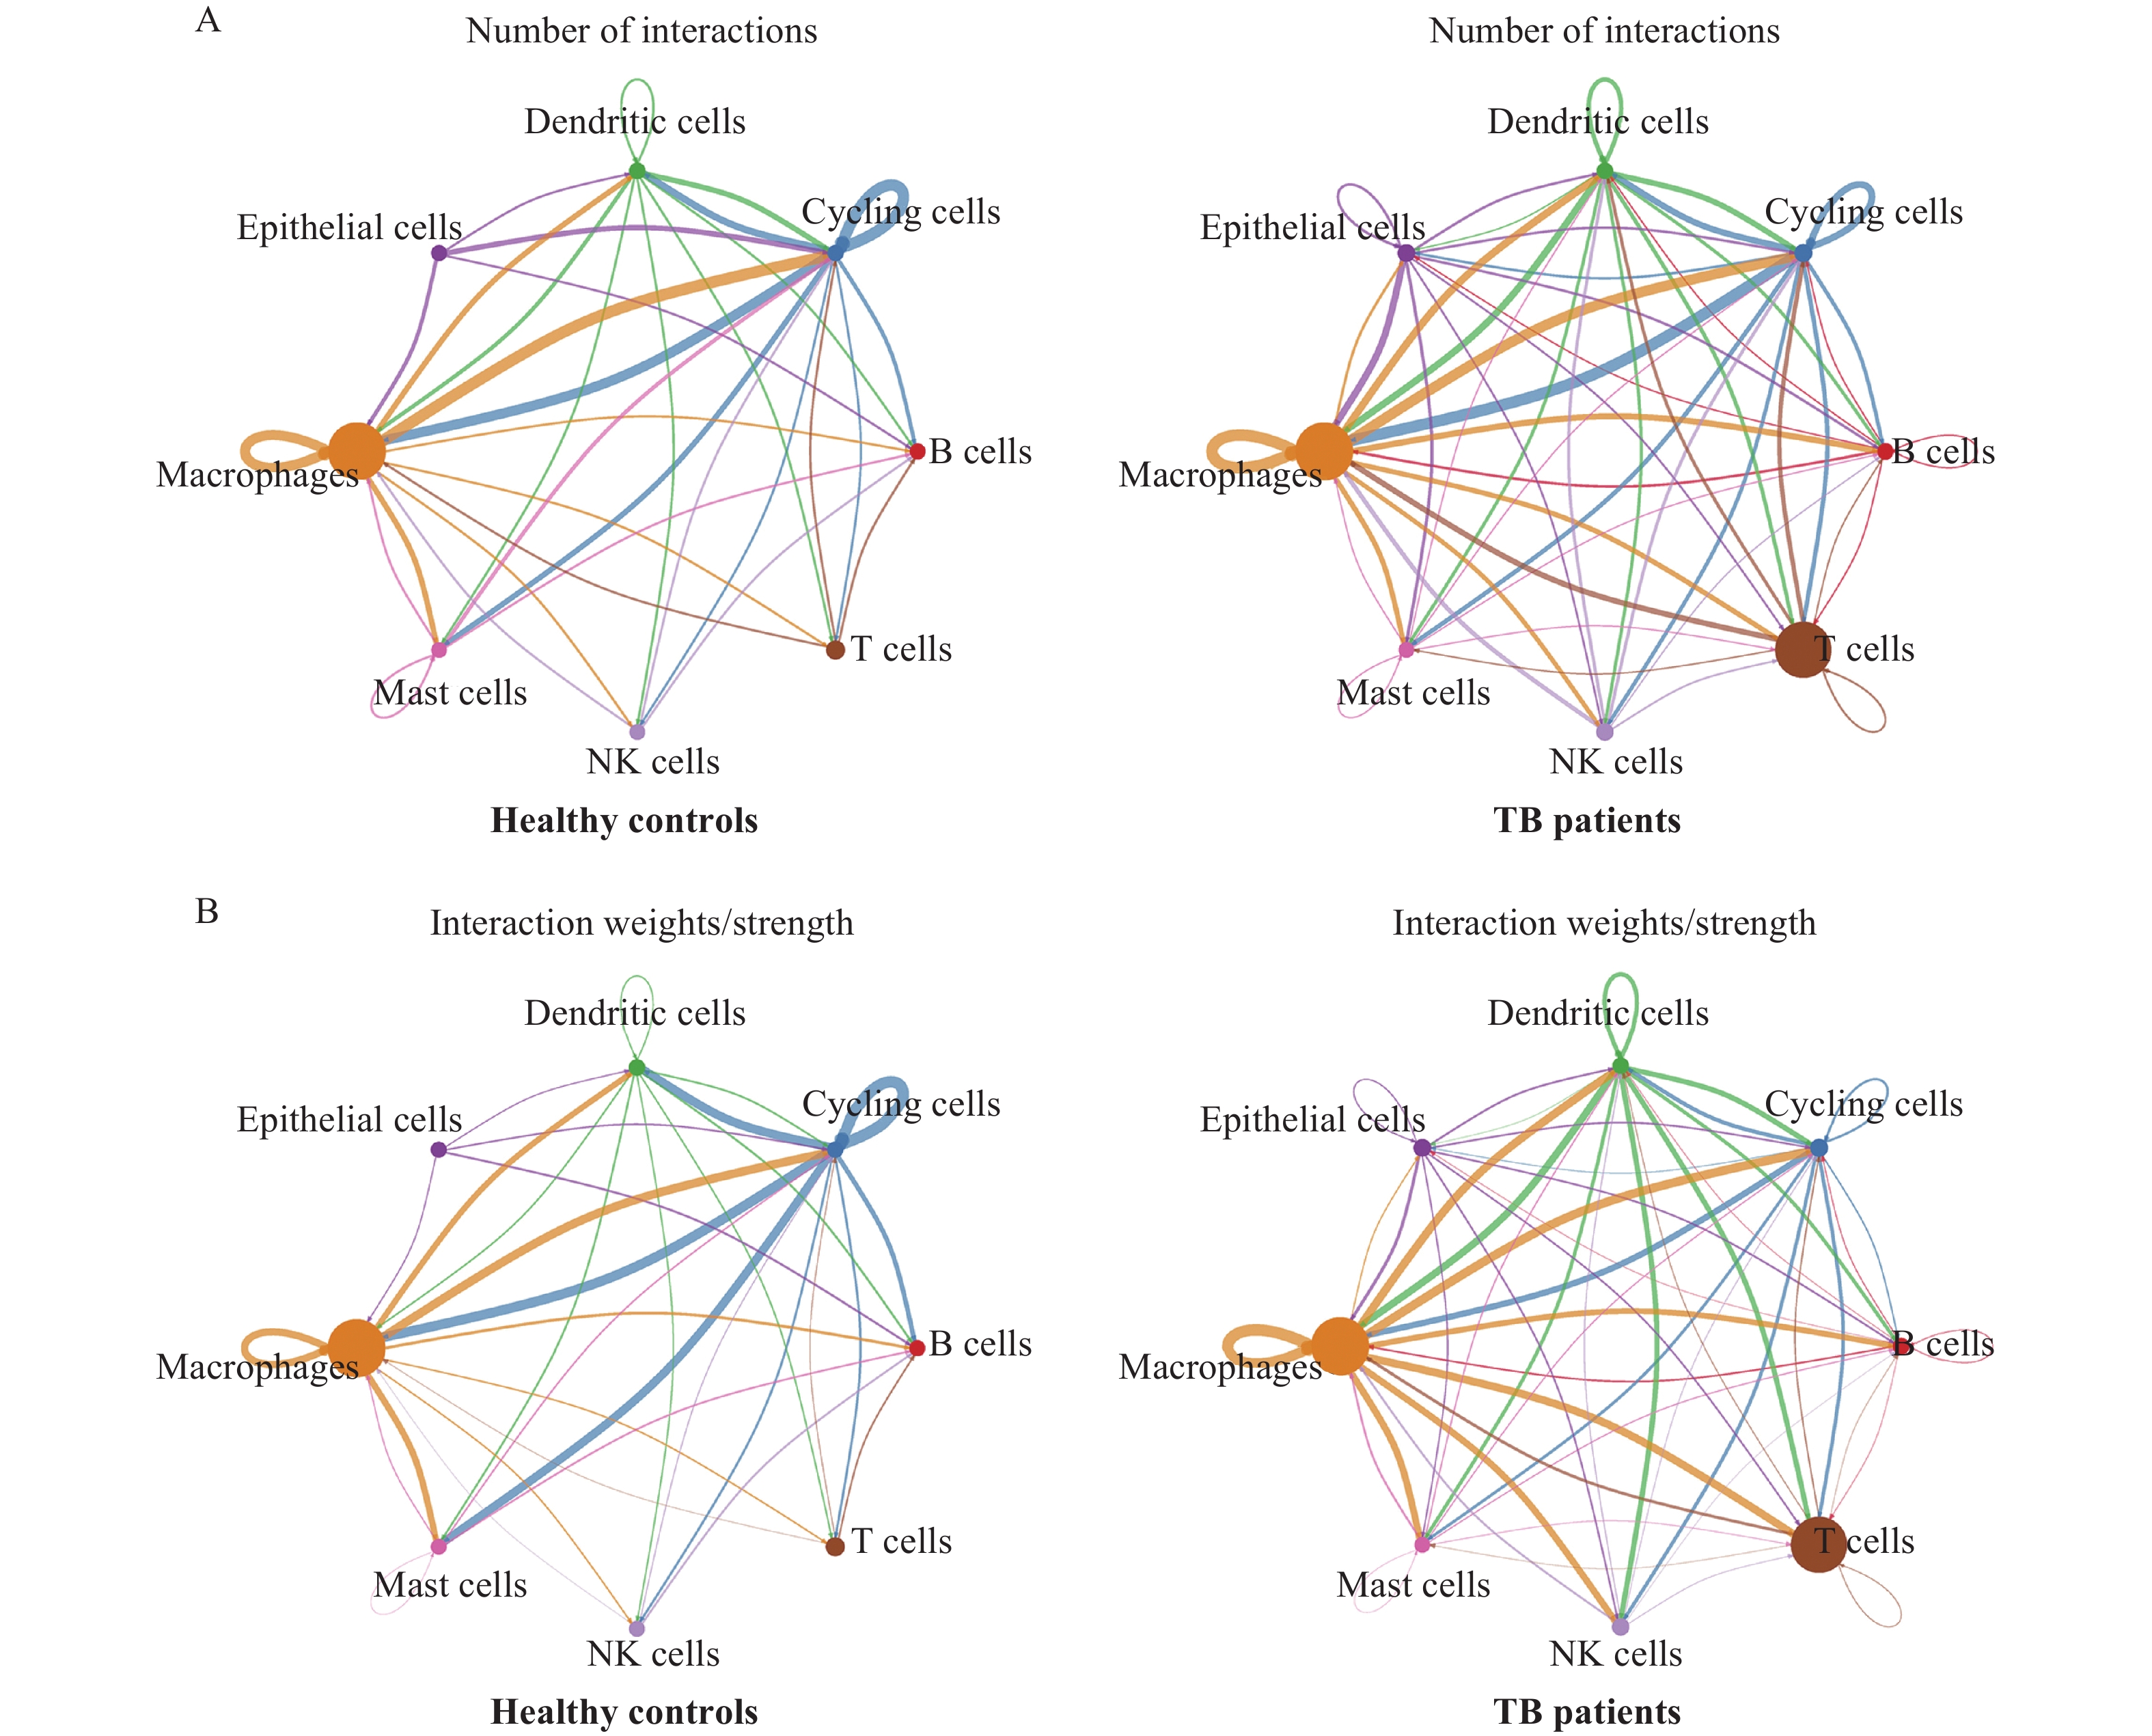
![]() Intercellular communications between macrophages and other cell types in tuberculosis patients and healthy controls.
Intercellular communications between macrophages and other cell types in tuberculosis patients and healthy controls.
-
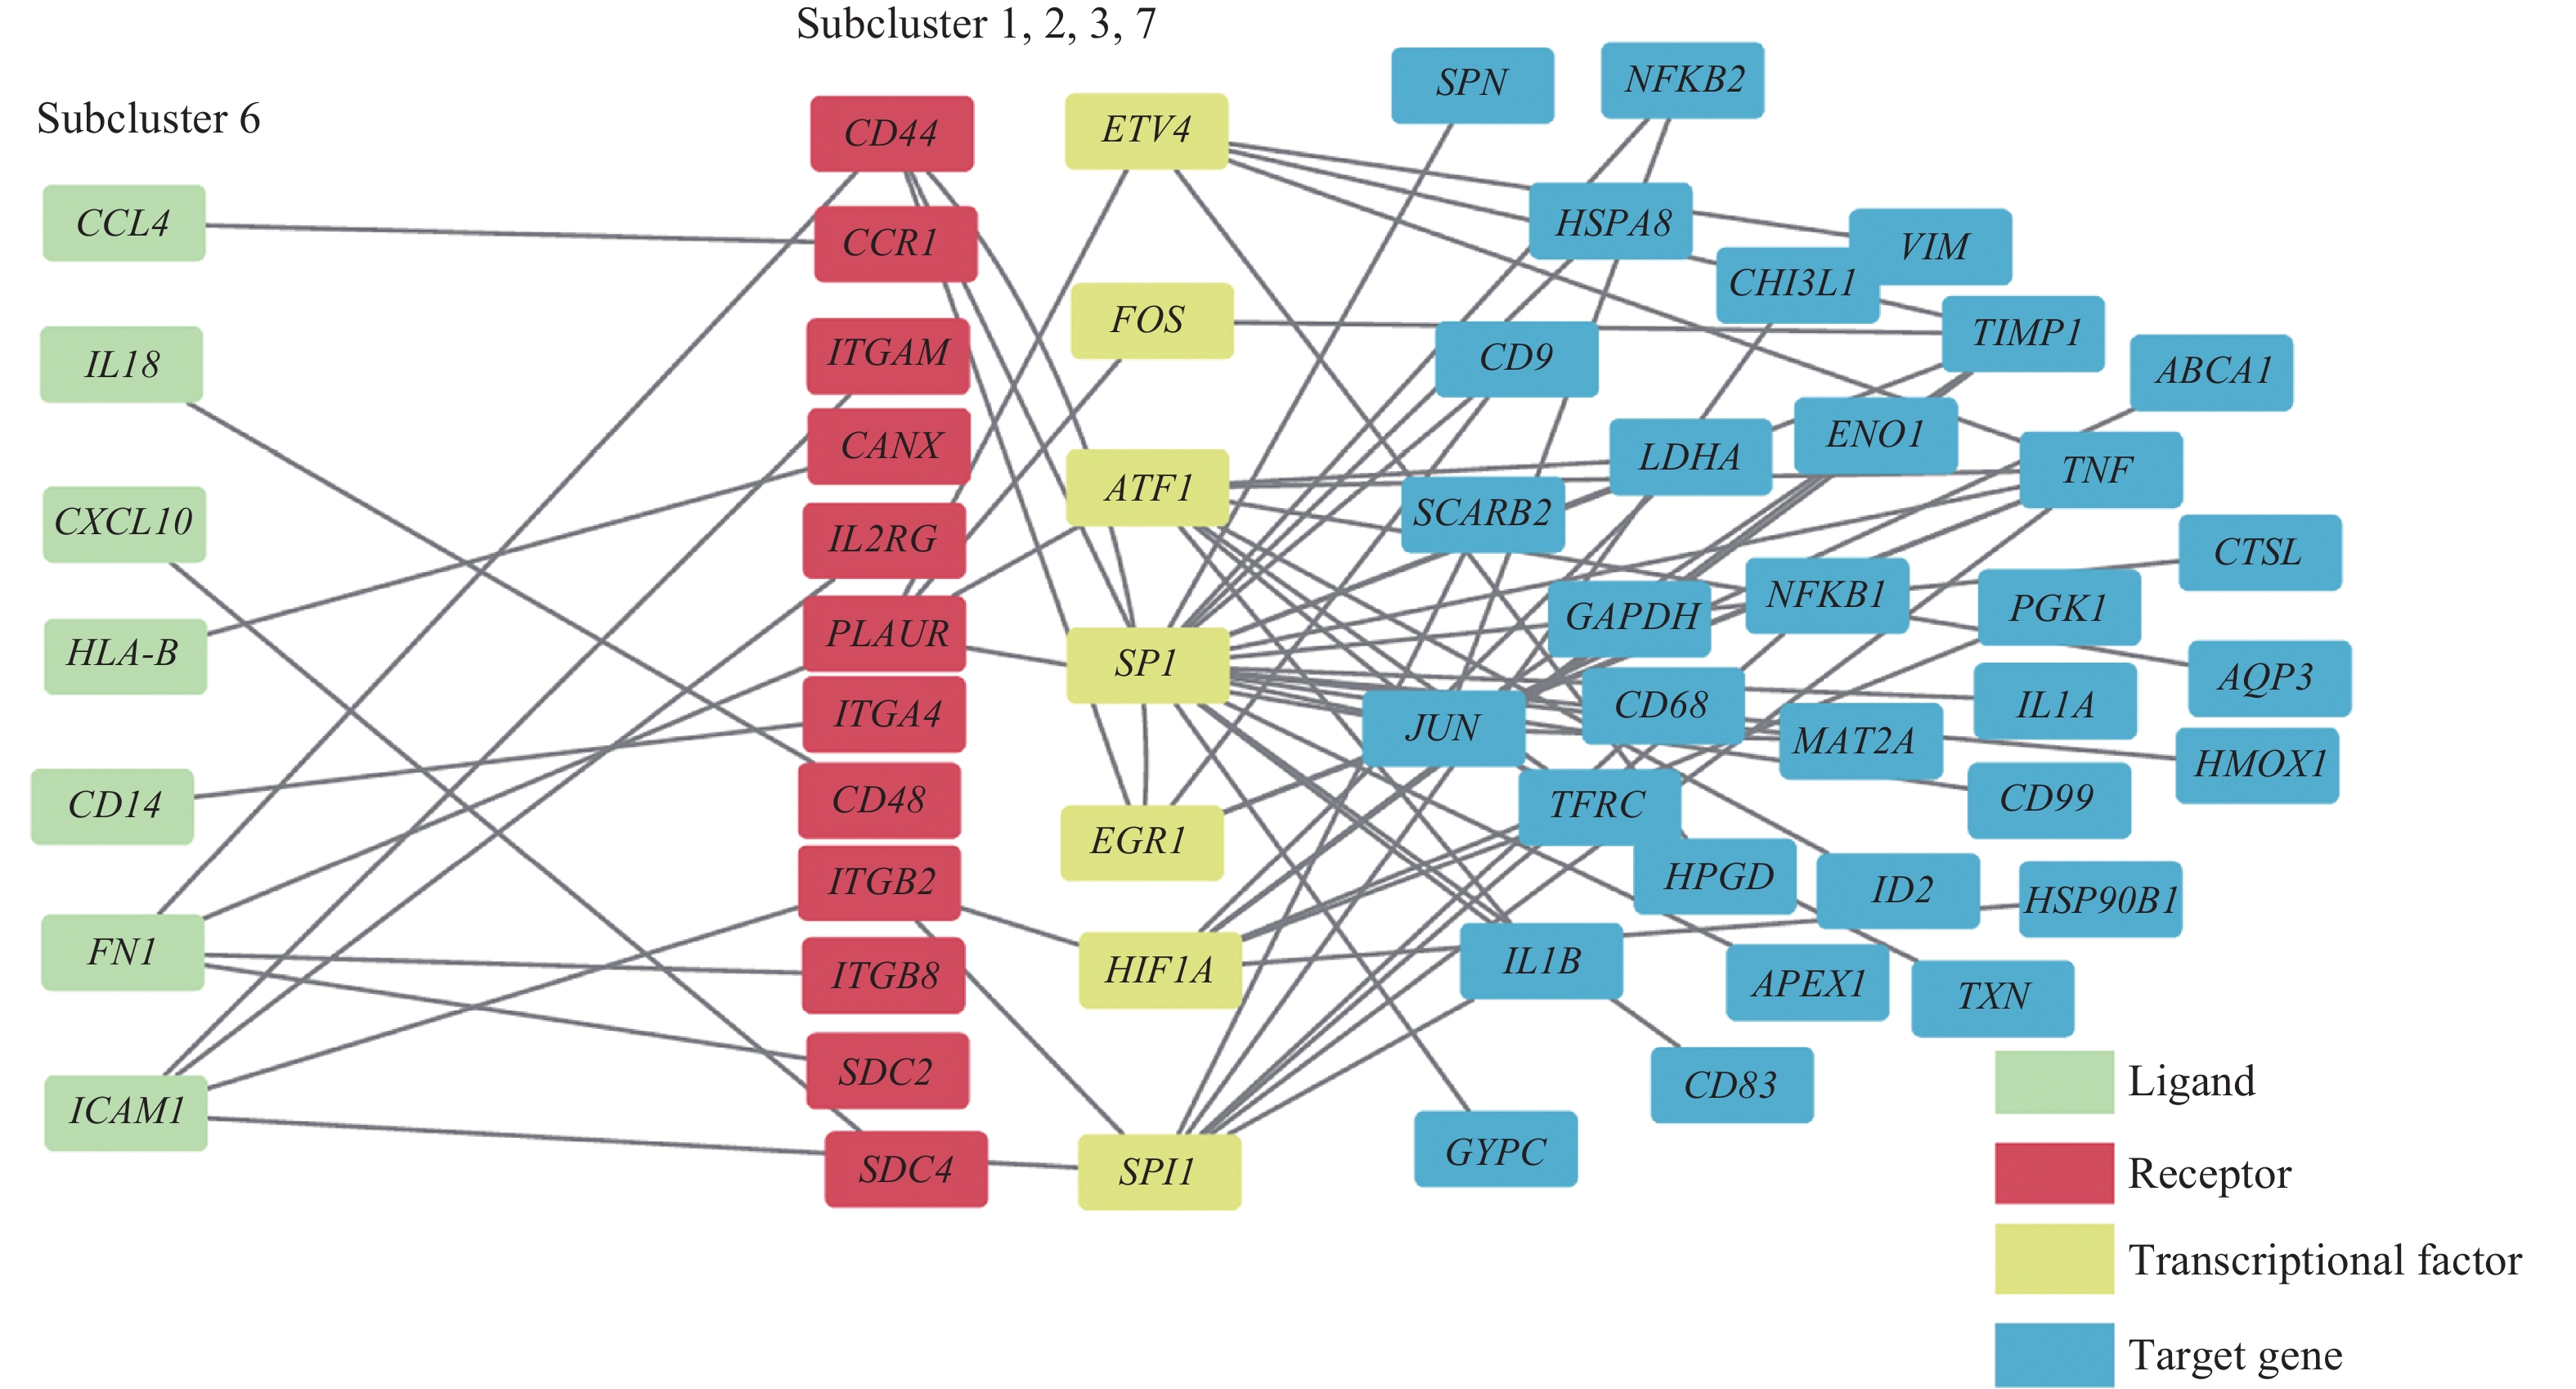
![]() Multilayer intercellular and intracellular signal networks among different macrophage subclusters.
Multilayer intercellular and intracellular signal networks among different macrophage subclusters.


Related articles
-
2024, 38(5): 500-511. DOI: 10.7555/JBR.37.20230320
-
2024, 38(4): 358-368. DOI: 10.7555/JBR.38.20240030
-
2023, 37(3): 166-178. DOI: 10.7555/JBR.36.20220221
-
2021, 35(4): 264-276. DOI: 10.7555/JBR.35.20210026
-
2019, 33(6): 371-381. DOI: 10.7555/JBR.33.20190015
-
Cell-free plasma hypermethylated CASZ1, CDH13 and ING2 are promising biomarkers of esophageal cancer2018, 32(6): 424-433. DOI: 10.7555/JBR.32.20170065
-
2015, 29(5): 397-404. DOI: 10.7555/JBR.29.20140088
-
2014, 28(4): 299-308. DOI: 10.7555/JBR.27.20130072
-
2011, 25(3): 165-169. DOI: 10.1016/S1674-8301(11)60021-3
-
2010, 24(1): 33-42.
