 Authors and Reviewers
Figures of the Article
-
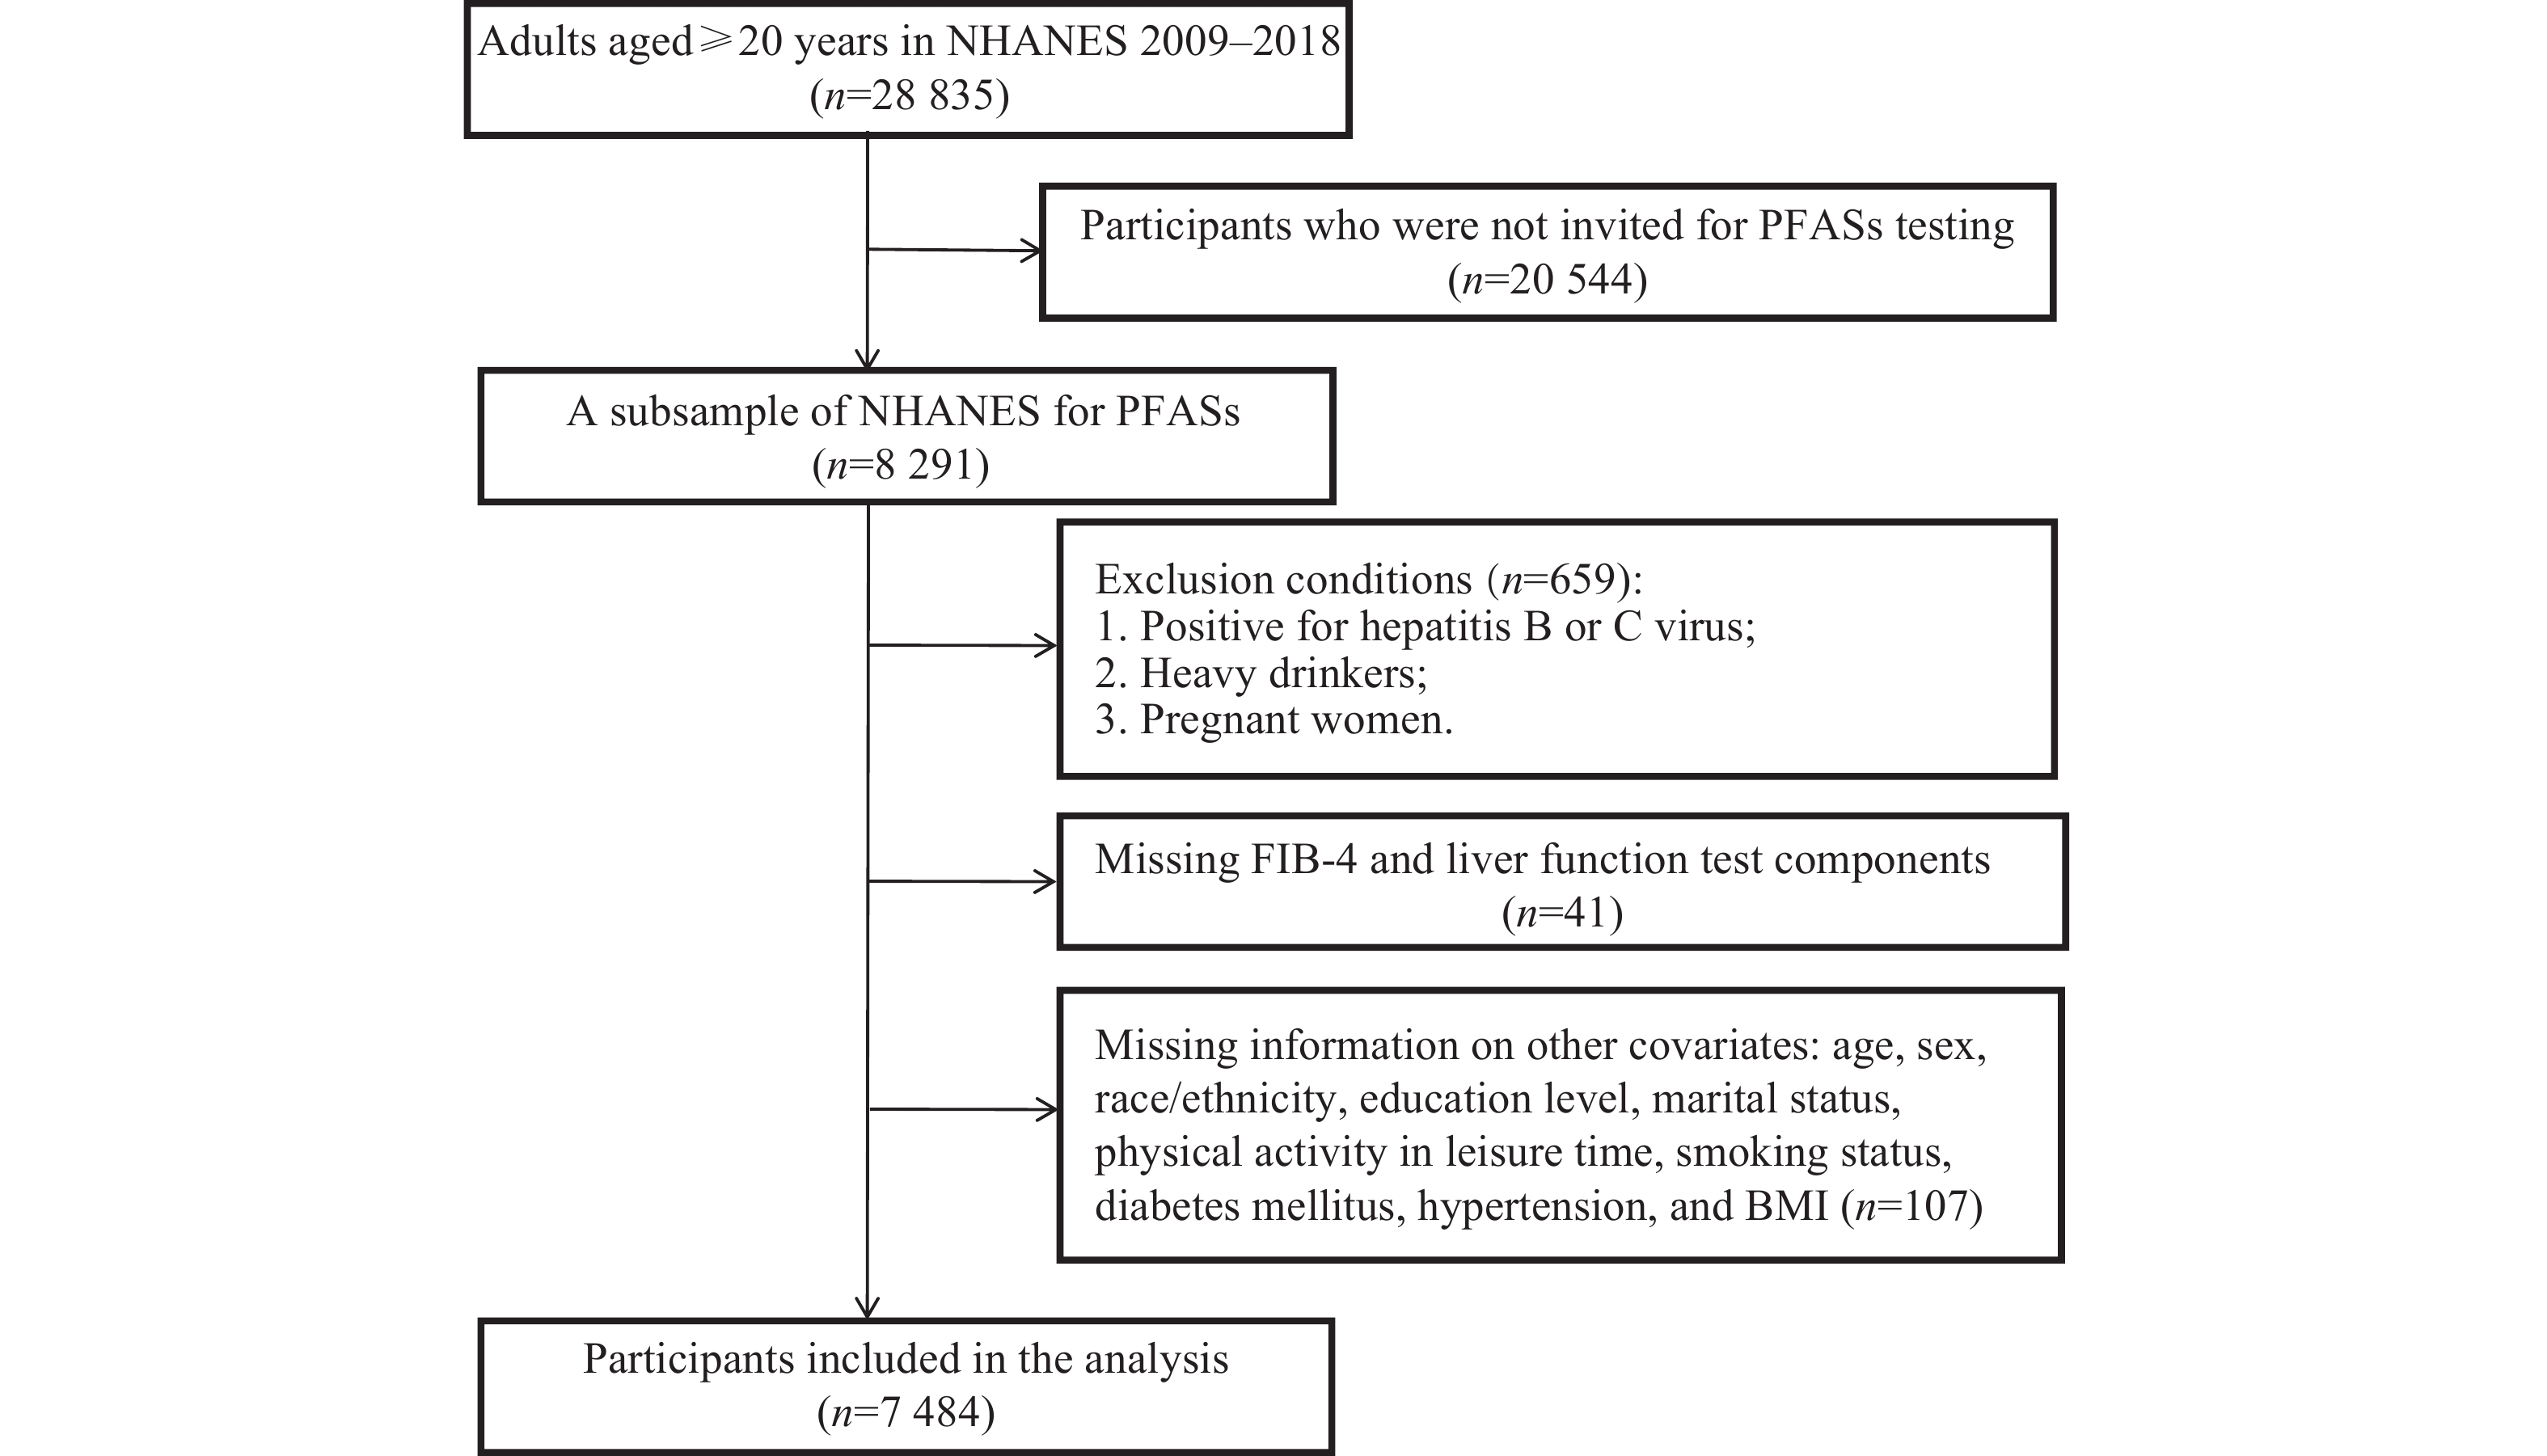
![]() Flow chart of the selection process of the participants in the current study.
Flow chart of the selection process of the participants in the current study.
-
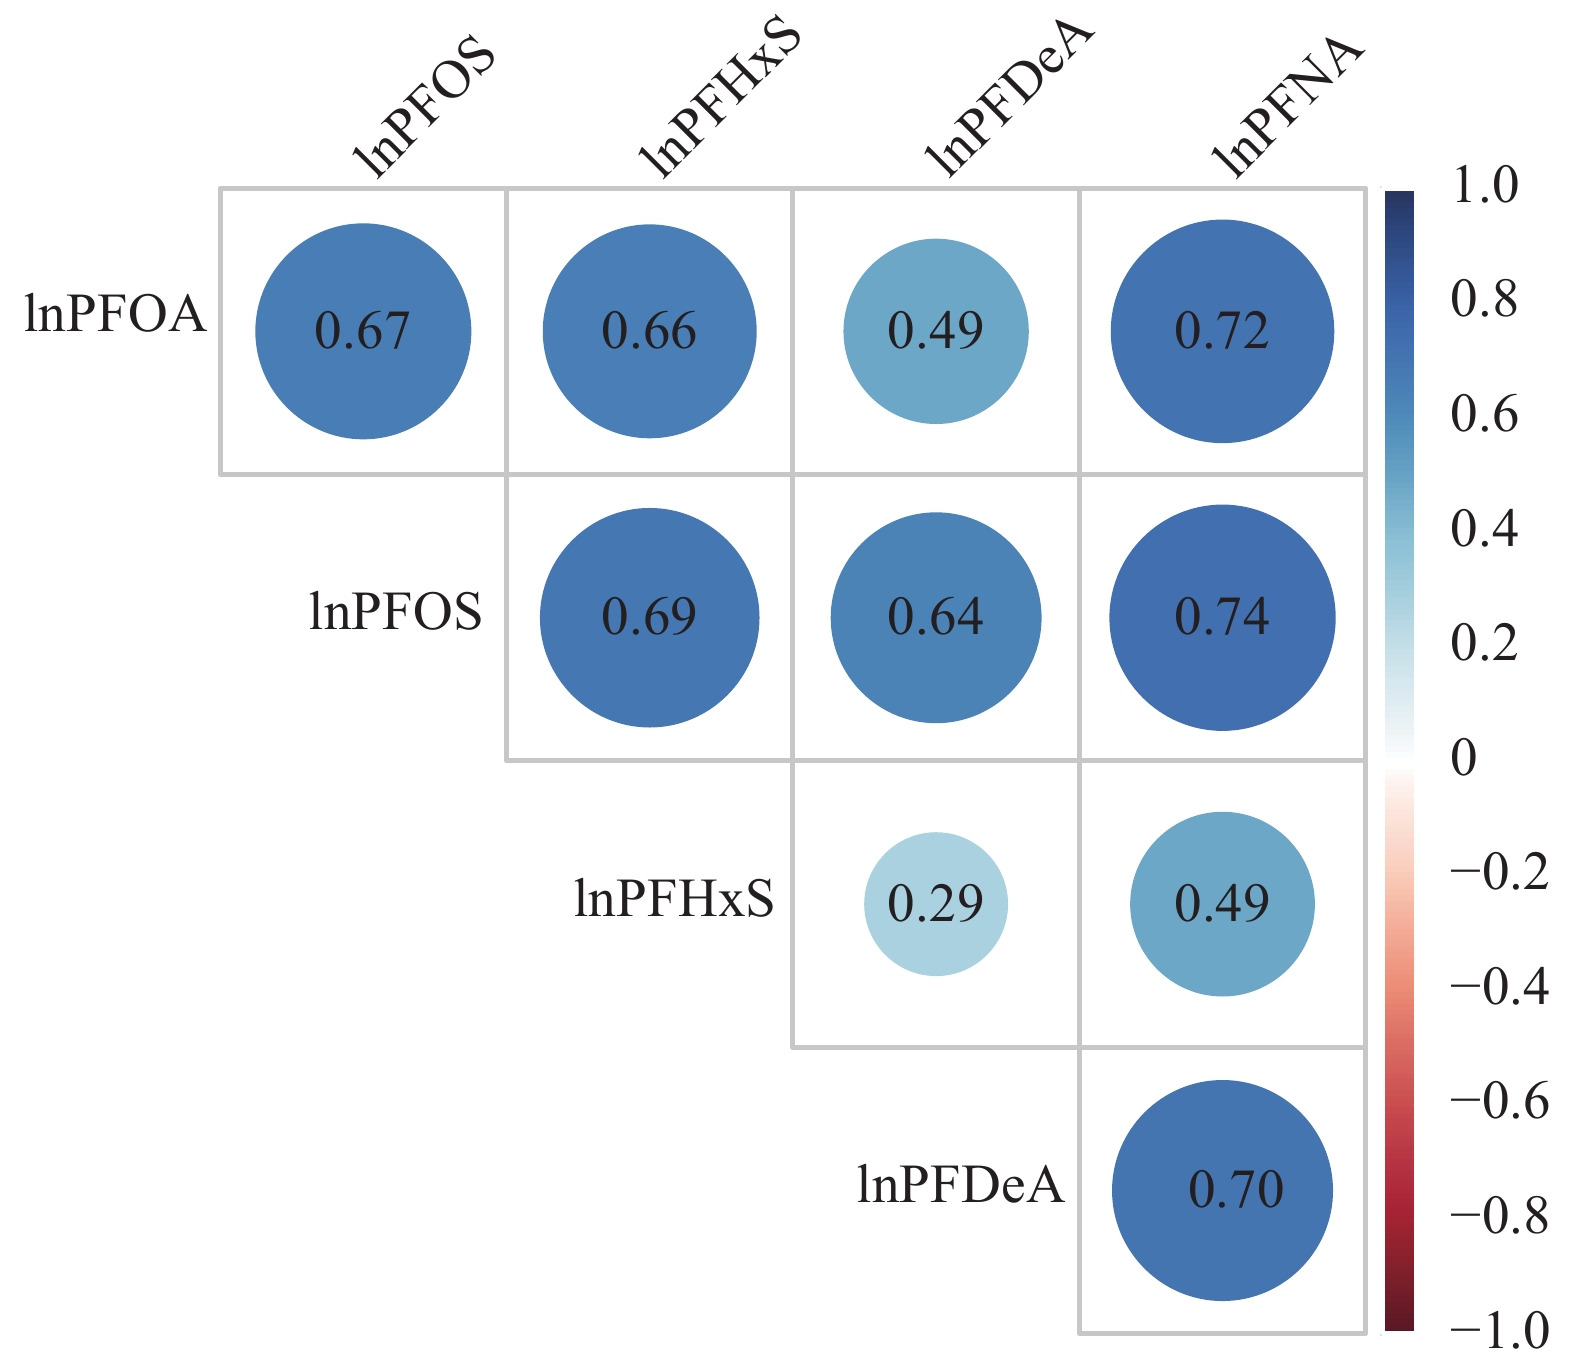
![]() The Pearson correlation analysis on the serum concentrations of the five PFASs in the study participants.
The Pearson correlation analysis on the serum concentrations of the five PFASs in the study participants.
-
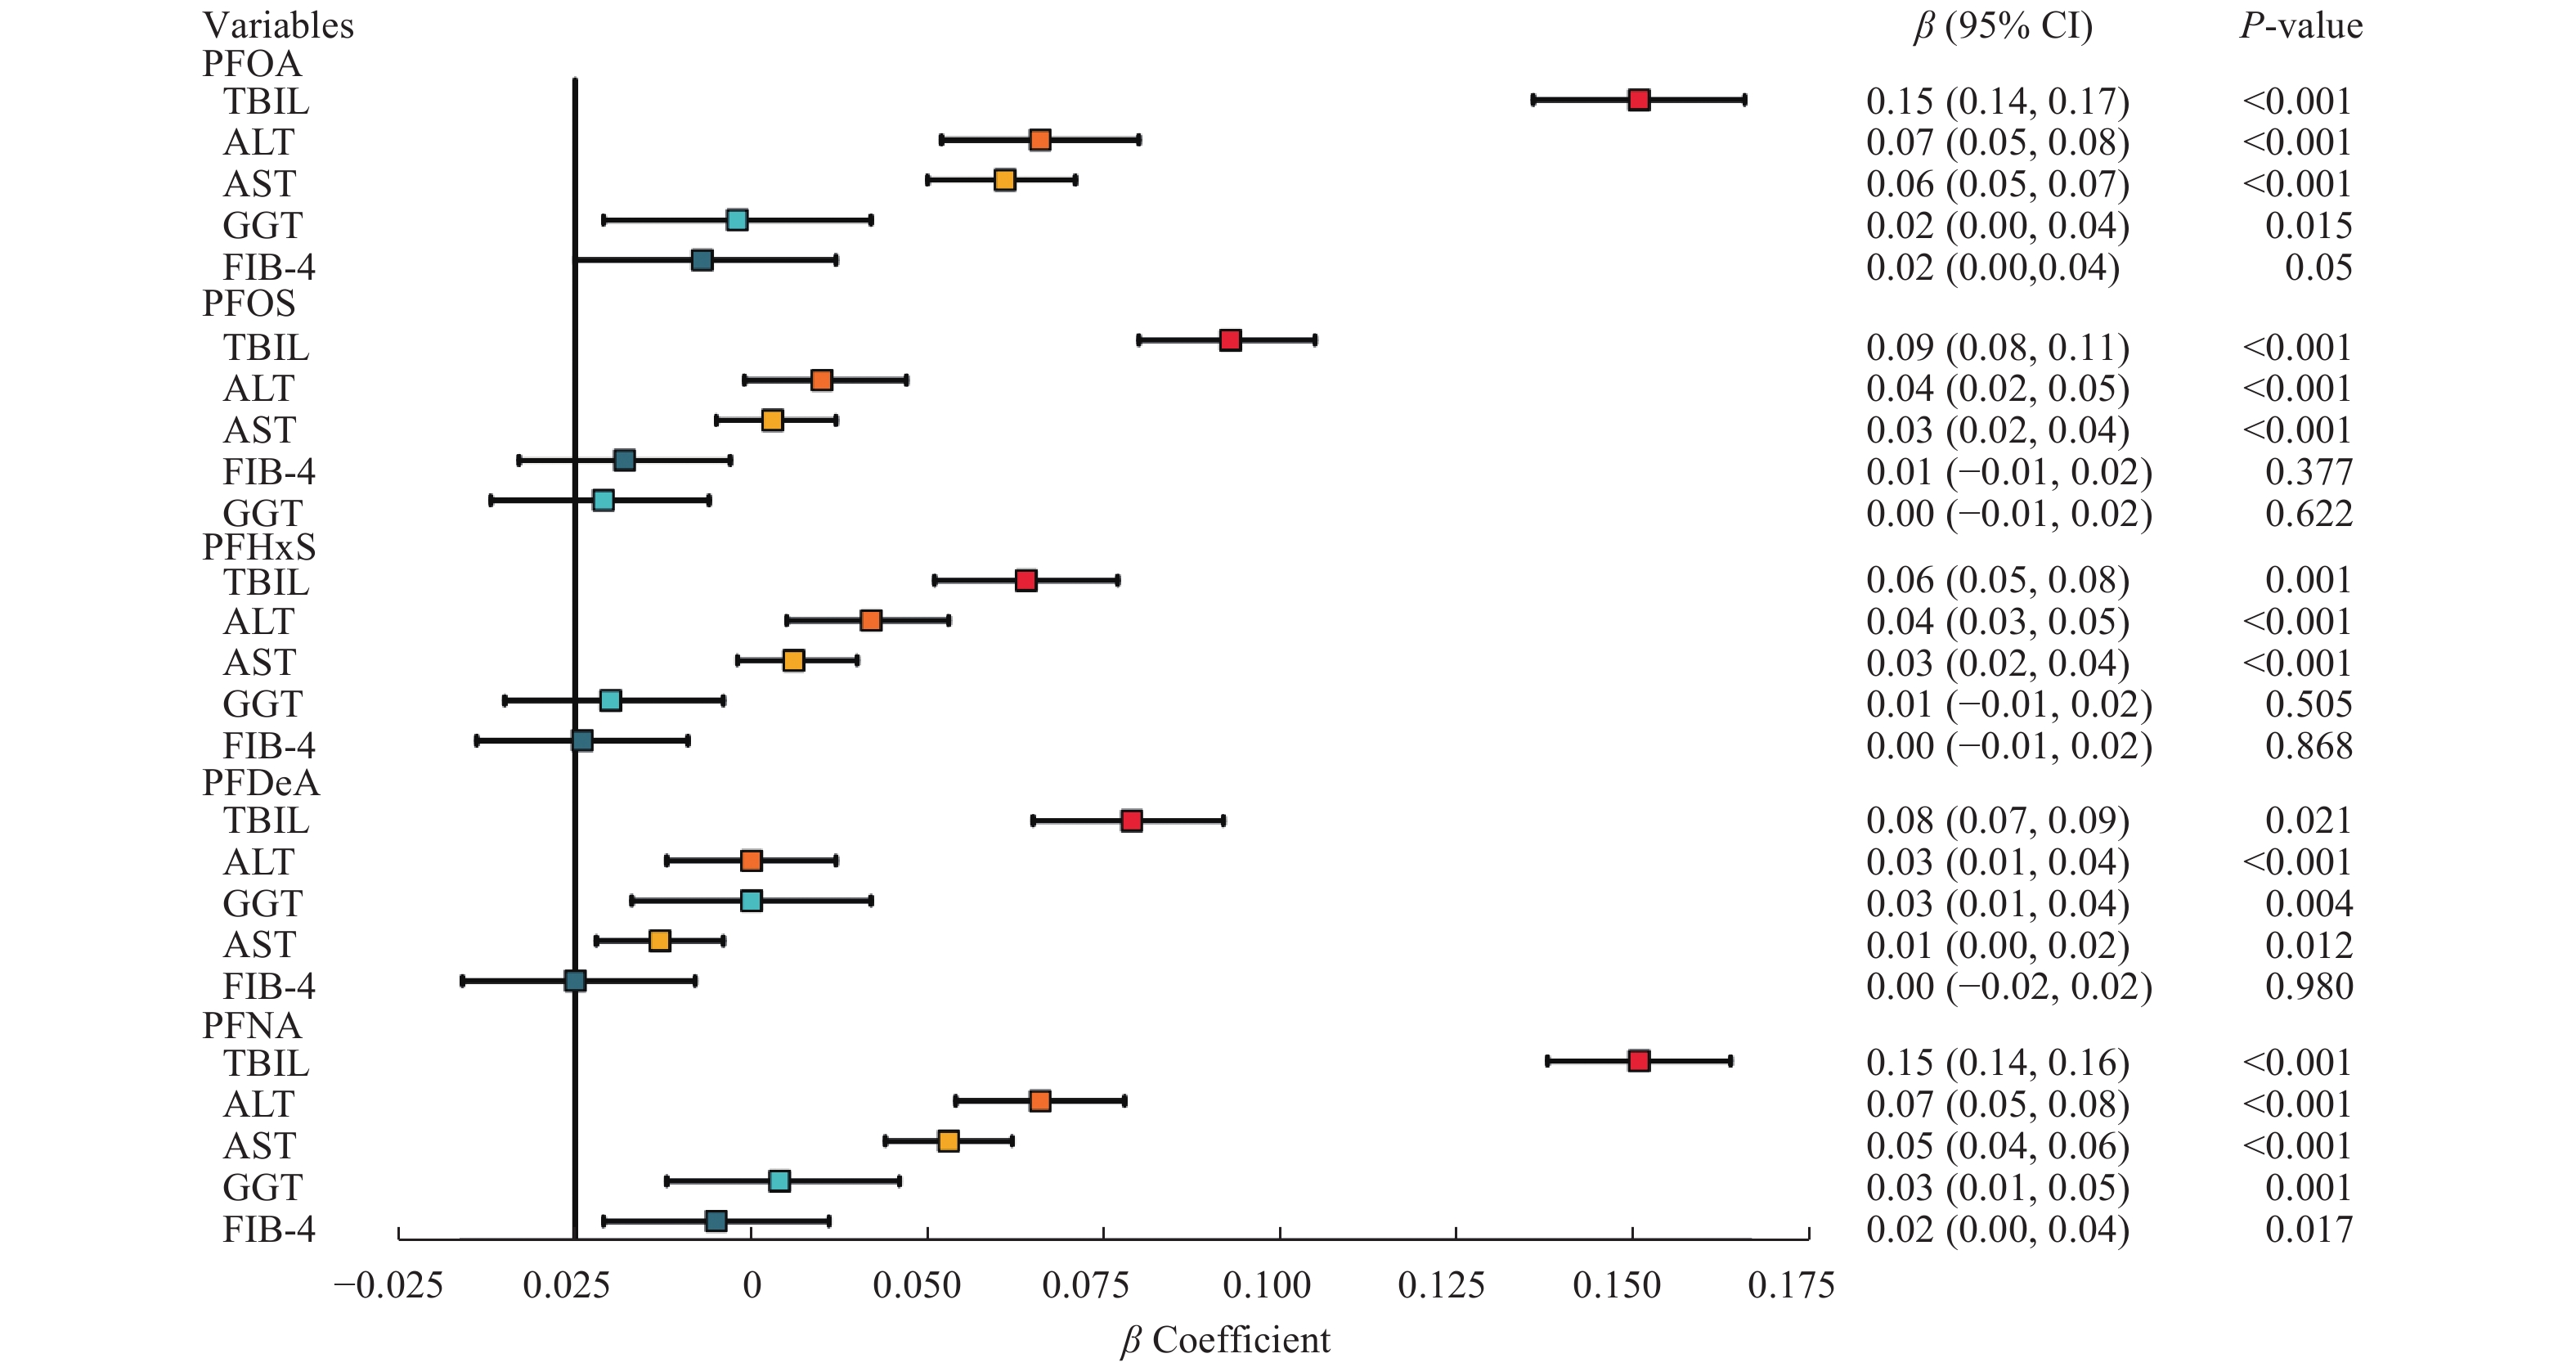
![]() Multivariable linear regression analyses of the serum PFAS levels with liver function tests and FIB-4 index in the study participants.
Multivariable linear regression analyses of the serum PFAS levels with liver function tests and FIB-4 index in the study participants.
-
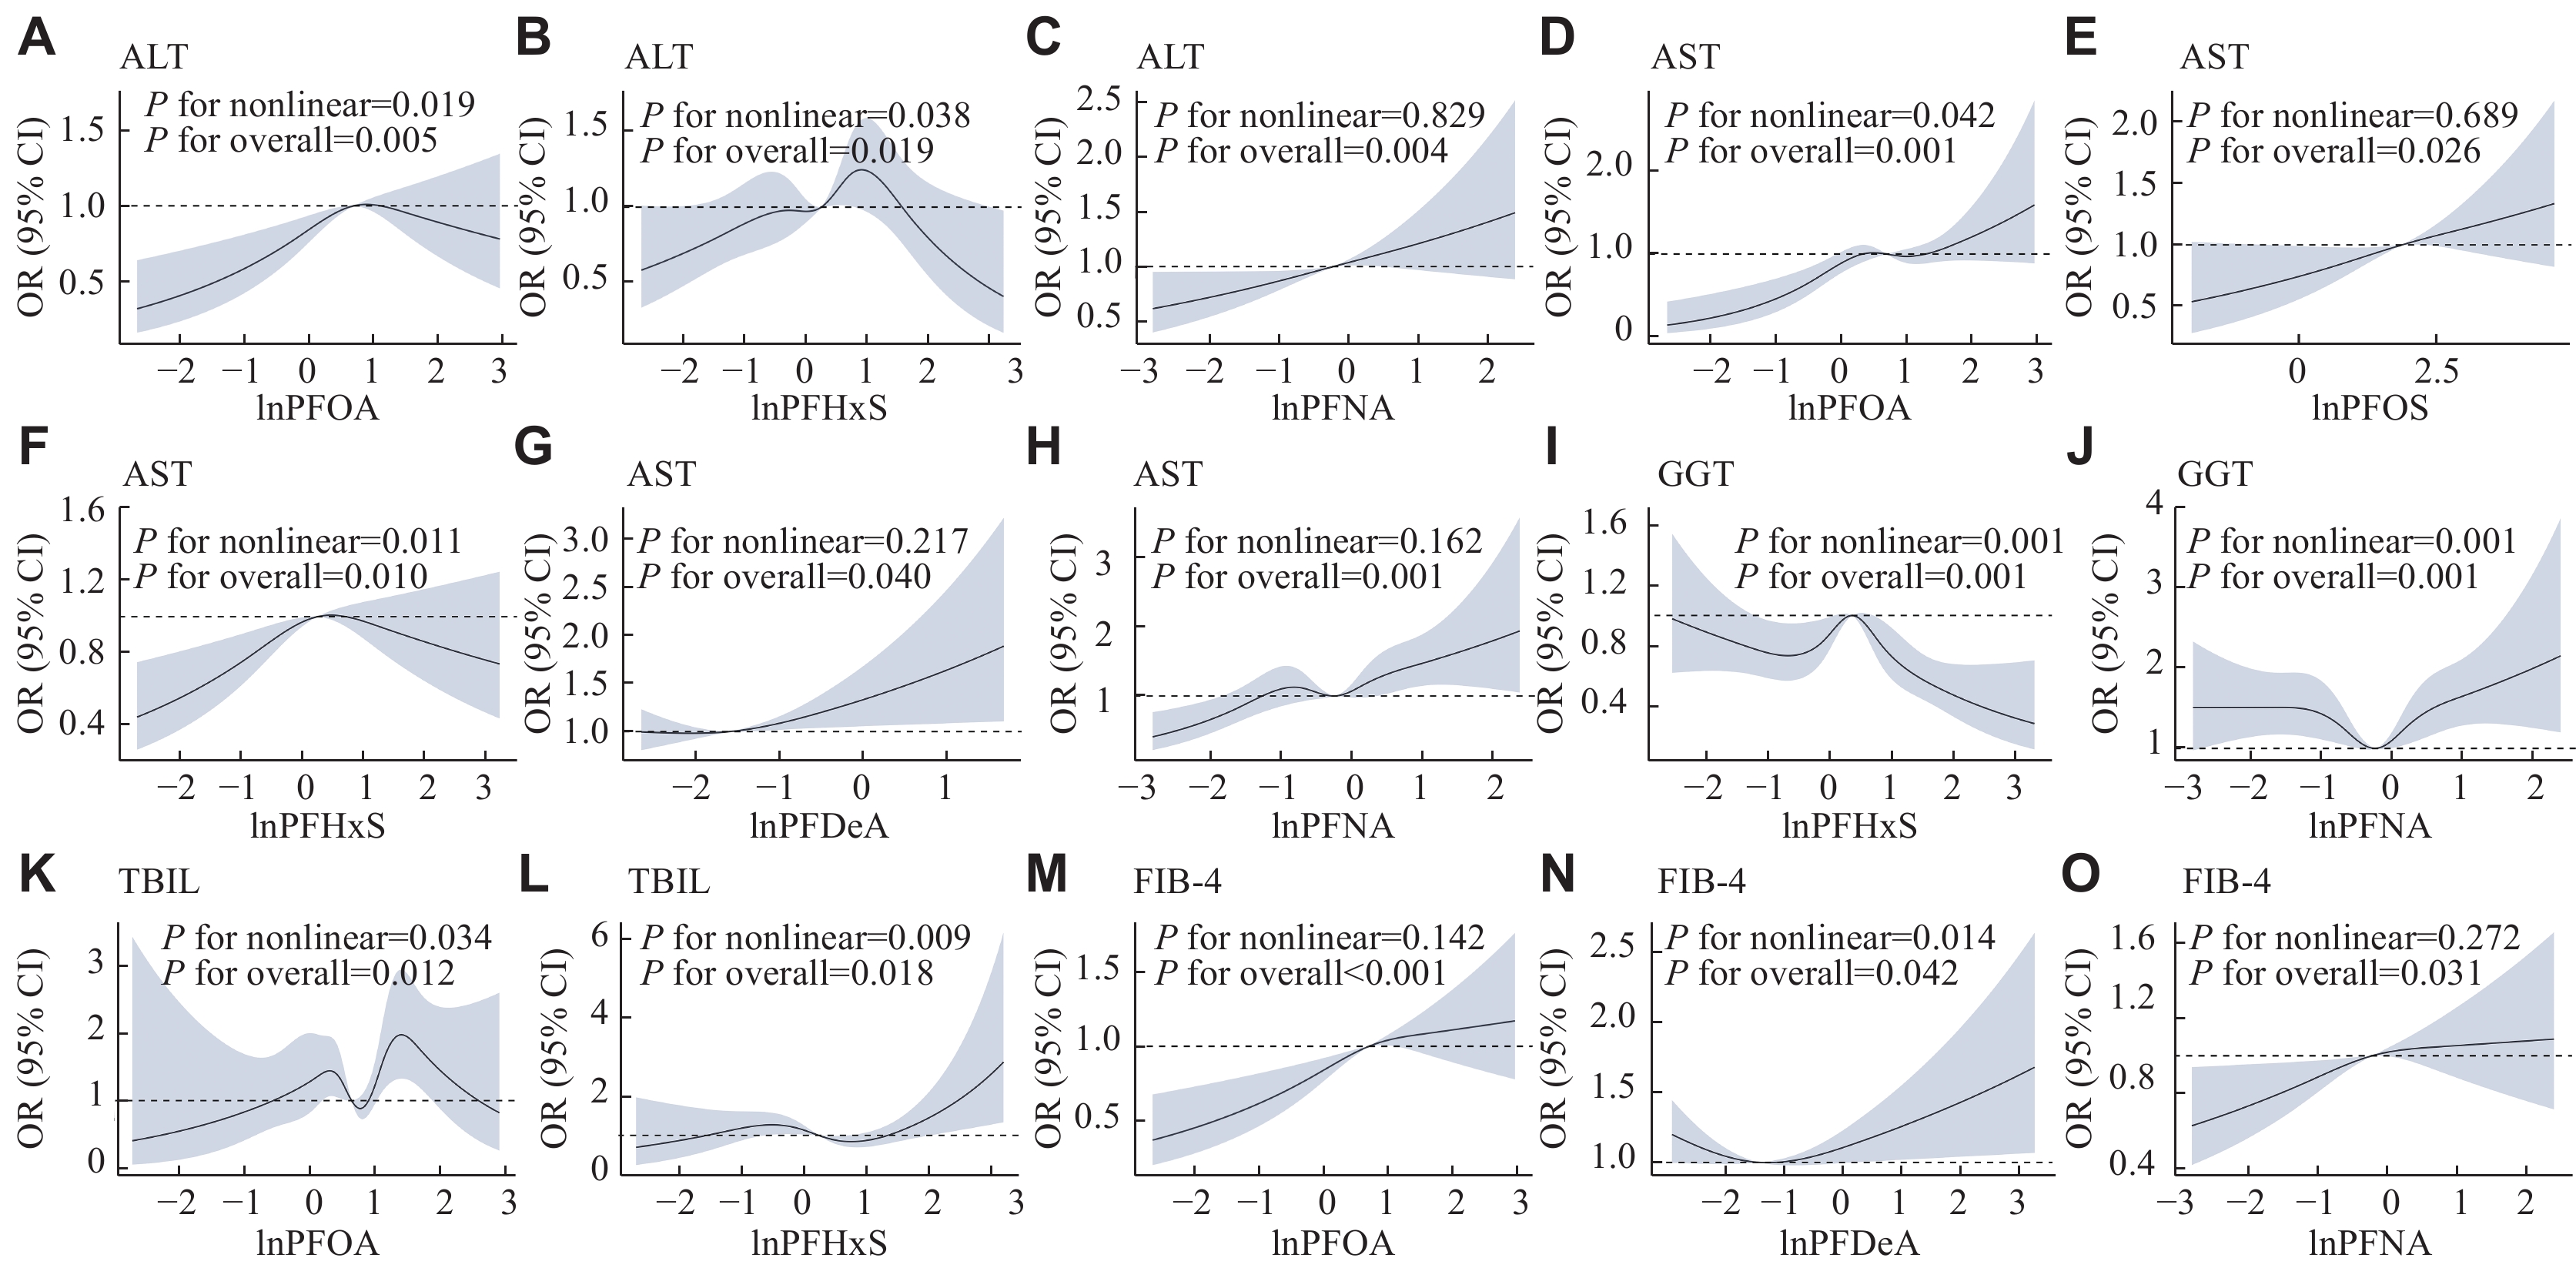
![]() Restricted cubic spline regression analysis of the associations between the indicators of liver injury and the serum PFAS levels in the study participants.
Restricted cubic spline regression analysis of the associations between the indicators of liver injury and the serum PFAS levels in the study participants.
-
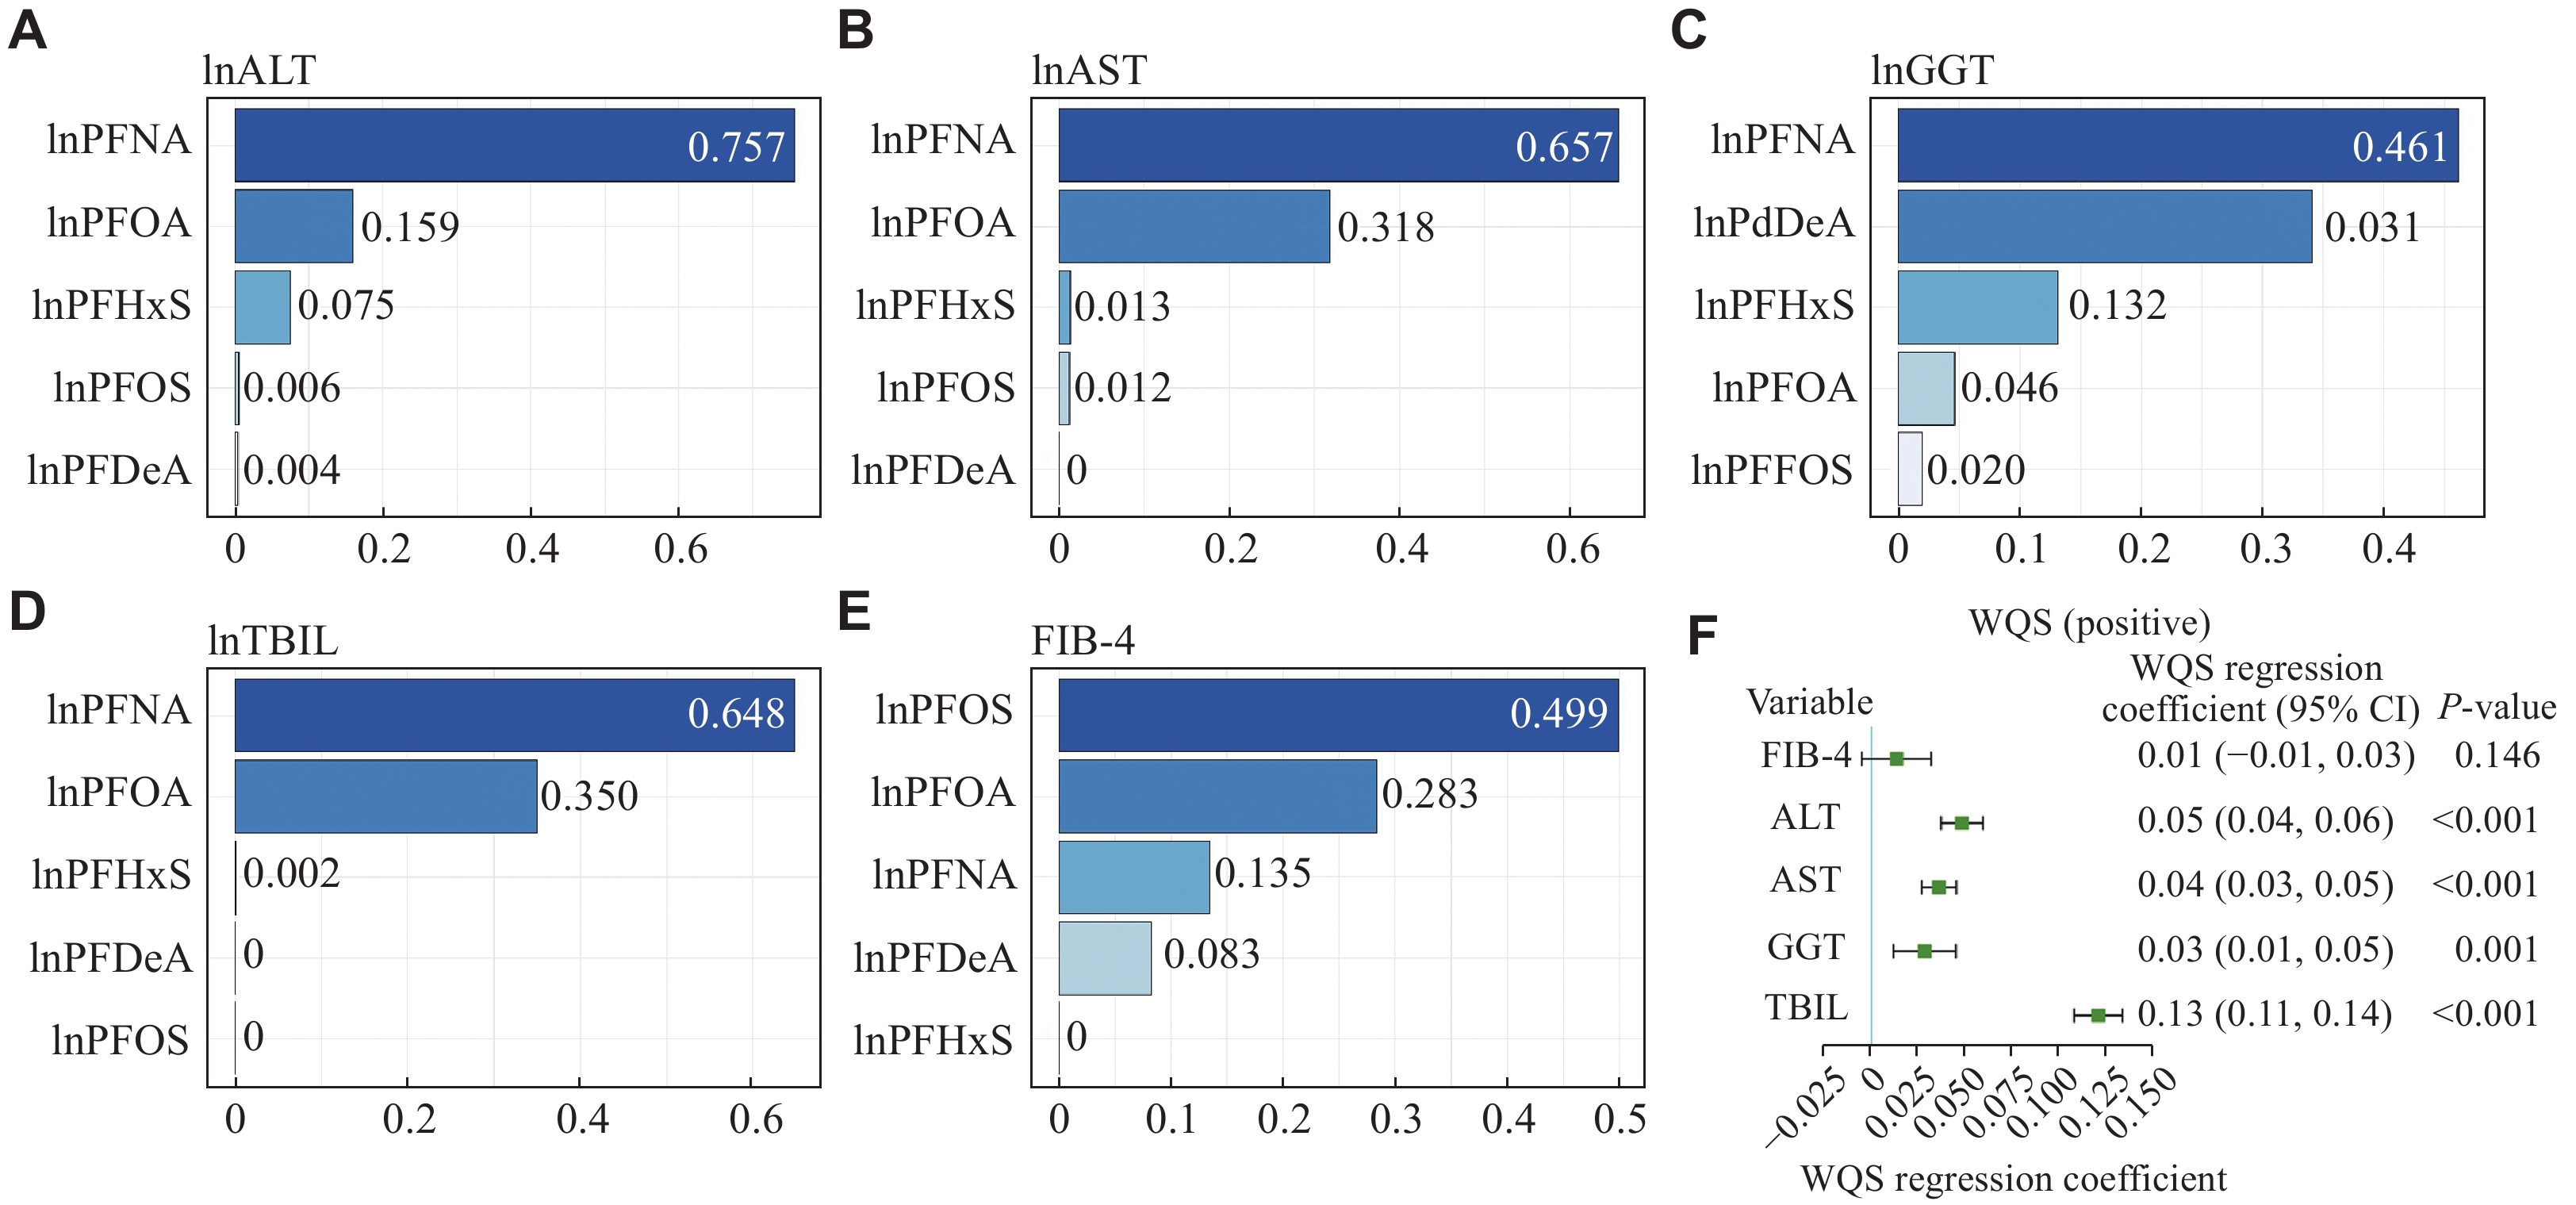
![]() The estimated risk and weighted values of PFASs for liver injury by the WQS models.
The estimated risk and weighted values of PFASs for liver injury by the WQS models.
Related articles
-
2025, 39(1): 61-75. DOI: 10.7555/JBR.38.20240020
-
2022, 36(3): 215-220. DOI: 10.7555/JBR.36.20220044
-
2019, 33(4): 221-234. DOI: 10.7555/JBR.32.20180087
-
2018, 32(6): 434-441. DOI: 10.7555/JBR.32.20170117
-
2018, 32(6): 411-423. DOI: 10.7555/JBR.32.20160170
-
2018, 32(6): 389-400. DOI: 10.7555/JBR.32.20180045
-
2017, 31(5): 437-444. DOI: 10.7555/JBR.31.20170031
-
2017, 31(4): 283-300. DOI: 10.7555/JBR.30.20160060
-
2013, 27(5): 430-434. DOI: 10.7555/JBR.27.20130053
-
2013, 27(1): 1-13. DOI: 10.7555/JBR.27.20120077
