Authors and Reviewers
Figure
1.
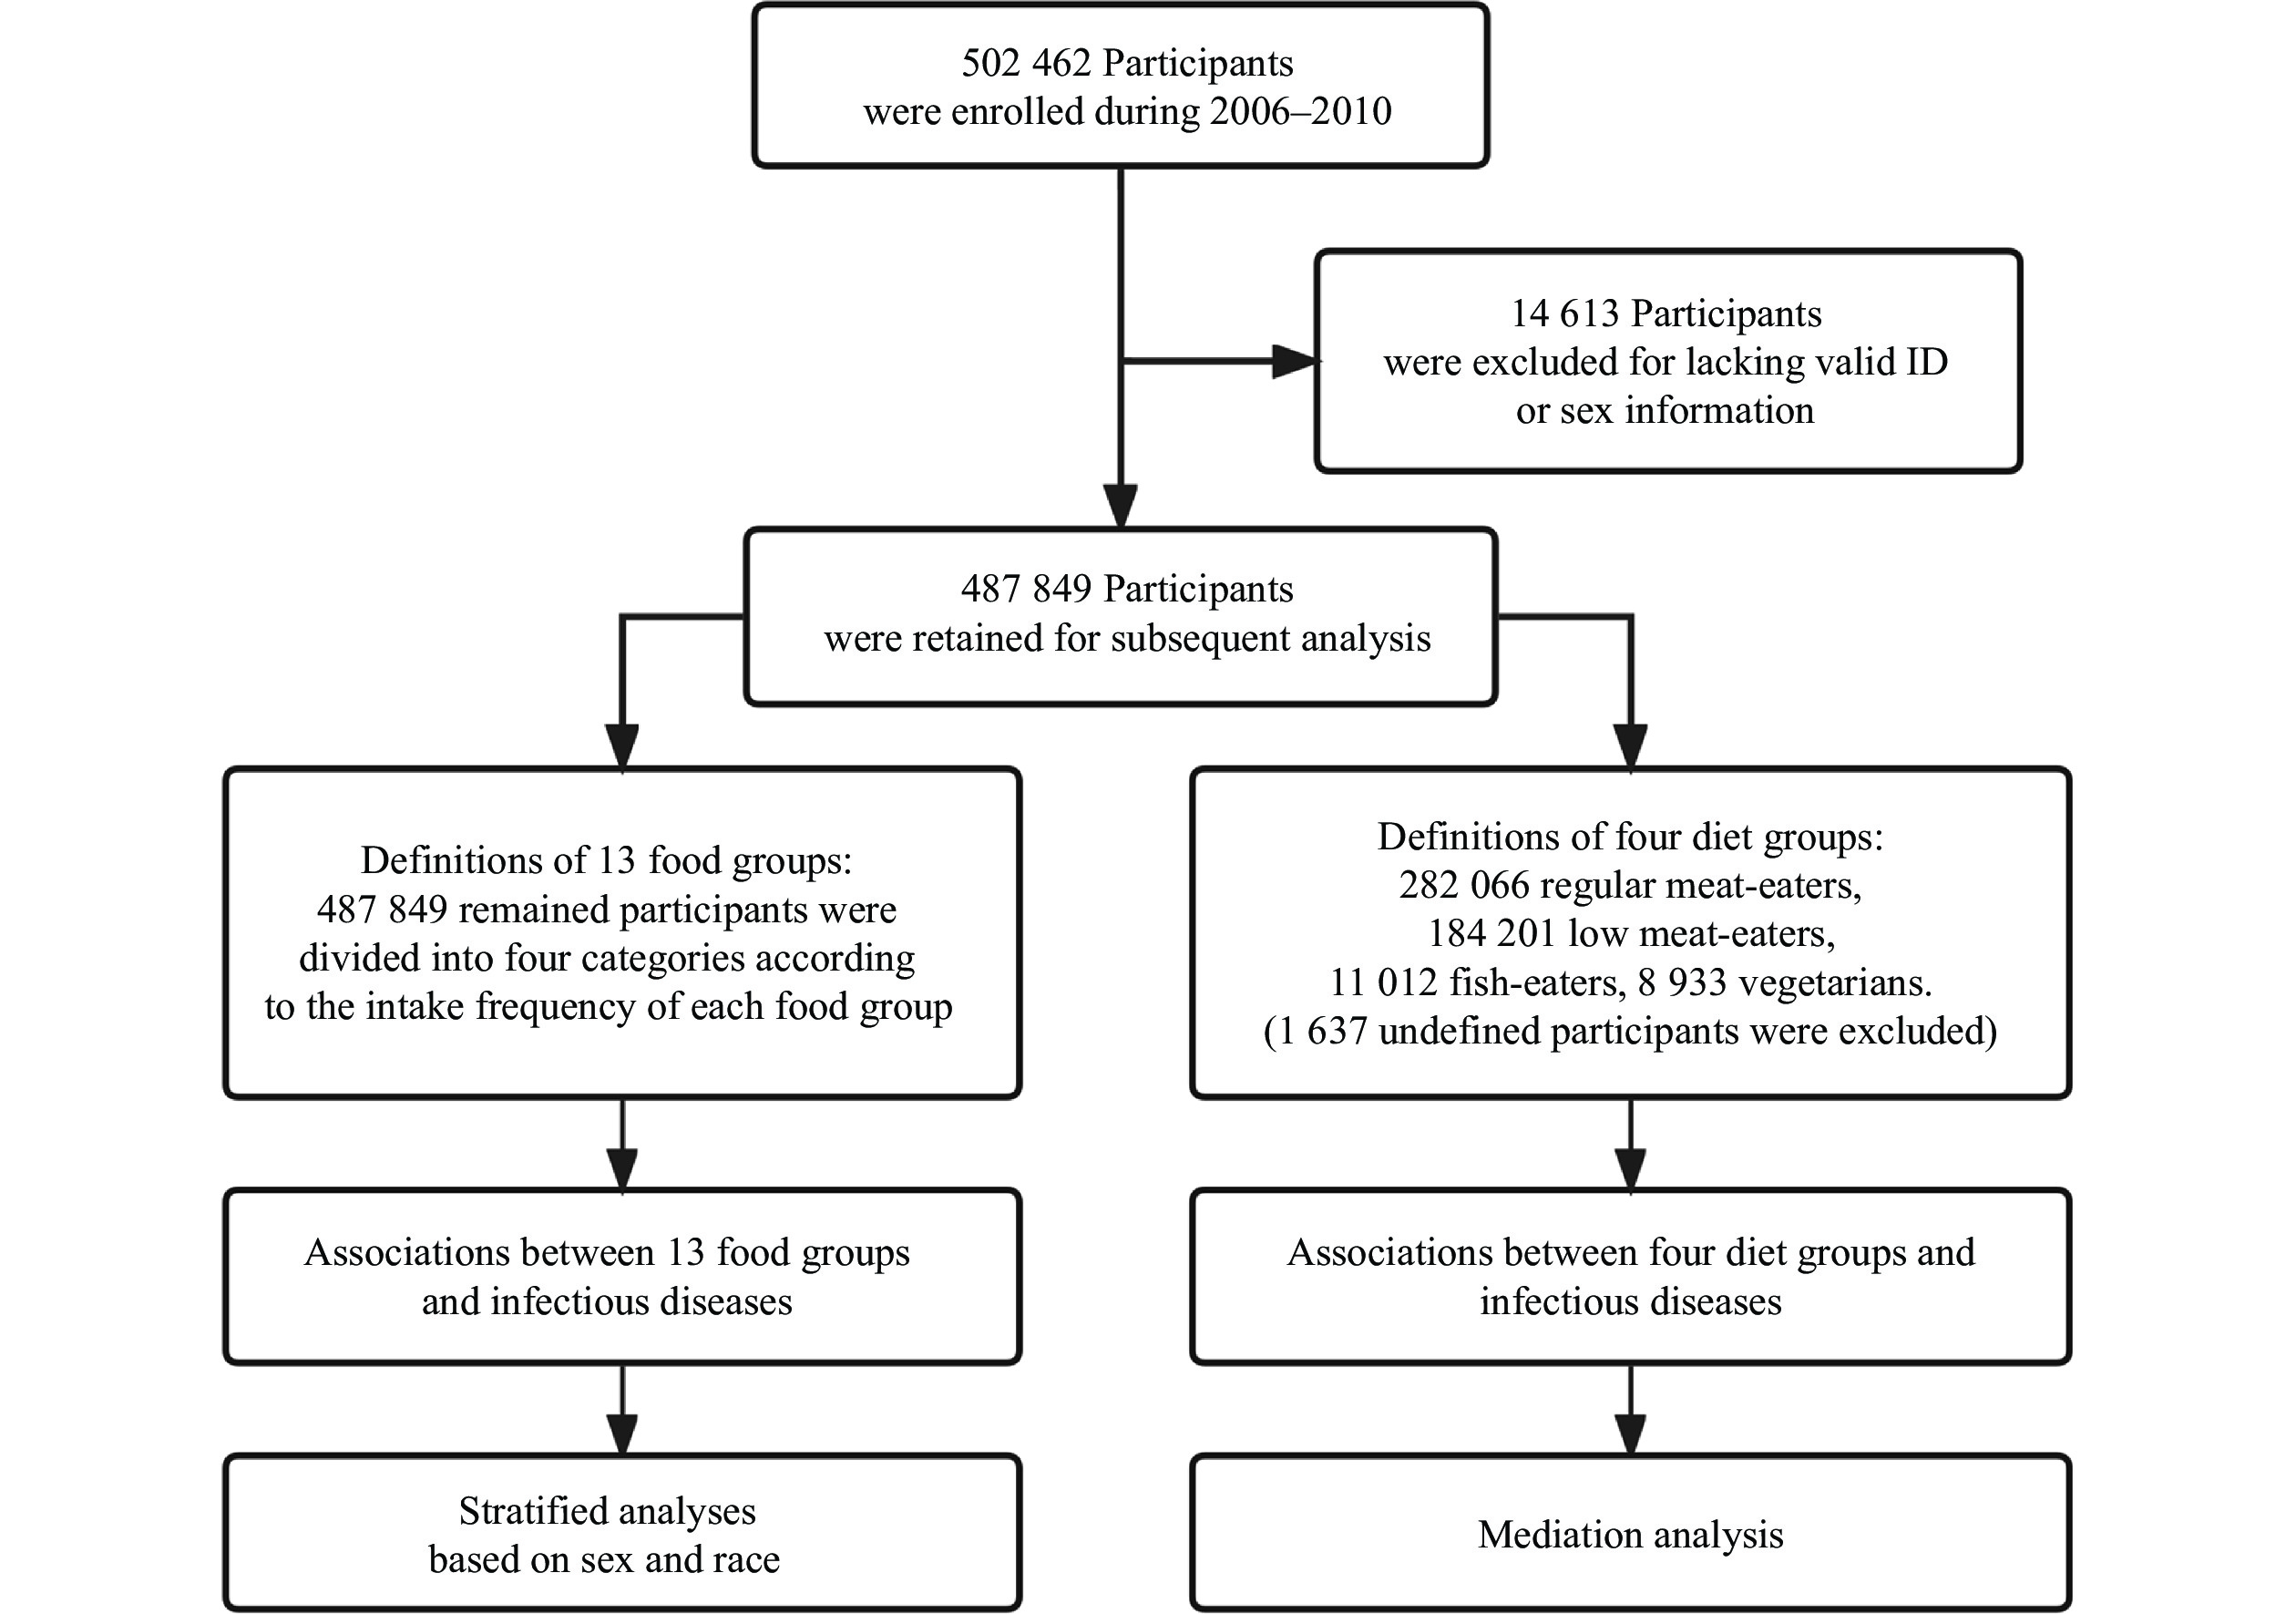
The flow diagram of participant selection in the UK Biobank.
4.6
2.2
| Citation: |
Junlan Tu, Xuehong Cai, Yifan Wang, Xiangyu Ye, Meijie Yu, Sheng Yang, Rongbin Yu, Peng Huang. Associations of diet with infectious diseases in UK Biobank[J]. The Journal of Biomedical Research, 2024, 38(6): 597-612. DOI: 10.7555/JBR.37.20230319

|
The current study used multivariable logistic regression analysis to investigate associations between the intake frequencies of 13 food groups (or four diet groups) and infectious diseases. The analysis included
Infectious diseases are a global threat that contributes to excess morbidity and mortality annually, with a persistent potential for unpredictable pandemics, leading to a severe burden of diseases[1–2]. Particularly, the emerging infectious coronavirus disease 2019 (COVID-19), which has been rampant over the past three years, served as a lesson to countries worldwide and forced us to refocus our attention on infectious diseases[3]. Therefore, it is of public health importance to investigate the pathways or factors that may prevent infectious diseases.
Infectious diseases are generally caused by microorganisms, yet exposure to the pathogens is a necessary but insufficient condition for infectious diseases[4]. The pandemic of infectious diseases is influenced by natural and social factors, with the social factors being notably more significant[5–6]. Diet, as a crucial lifestyle factor, plays a role in the occurrence and epidemic of diseases, and a high number of disability-adjusted life years have been reported to be attributable to dietary risk factors[7]. To date, research on the associations between diet and diseases has predominantly focused on non-communicable diseases, such as cancers, cardiovascular diseases, metabolic diseases, and obesity[8–11]. Numerous studies have demonstrated that diet is a crucial risk factor in non-communicable diseases. However, studies investigating the associations between diet and infectious diseases remain insufficient, and previous studies have only focused on a single infection[12–13]. Therefore, it is necessary and essential to conduct a prospective study with a large sample size to investigate the association between diet and the incidence of various infectious diseases.
Studies have demonstrated a strong association between diet and body metabolism. The types and quantities of food consumed regularly may significantly affect the metabolism, such as blood lipids and glycemic indices, including triglycerides (TG) and glycosylated hemoglobin (HbA1c)[14–15]. While studies have illuminated the critical role of body metabolism in various diseases, its involvement in the associations between diet and infectious diseases remains uninvestigated[16–17]. Furthermore, a balanced diet profoundly influences nutritional status of the body, and maintaining optimal nutrition may prevent numerous diseases and promote overall health[18–19]. Therefore, identifying indicators, such as body mass index (BMI), body fat percentage (BFP), and waist-to-hip ratio (WHR), that reflect the body's nutritional status, and investigating their roles in the associations between diet and infectious diseases may facilitate the prevention of infectious diseases. In addition, the immune level may also affect susceptibility to infectious diseases and their outcomes, so immune-related indicators, such as white blood cell count (WBC), should also be taken into consideration[20].
The United Kingdom (UK) Biobank is a large-scale research resource that contains lifestyle and health information from over
Here, we used data from the UK Biobank to evaluate the associations between infectious diseases (common subgroups: respiratory infectious diseases, digestive infectious diseases, and blood or sexually transmitted infectious diseases) and the consumption of various food groups. Subsequently, we conducted a series of subgroup analyses to assess these associations across sex and ethnic subpopulations. In addition, we assessed the associations of four common diets with infectious diseases and investigated the mediation effects of potential intermediate variables.
The UK Biobank is a large-scale research resource that contains half a million UK participants aged 40–70 years, recruited from 22 assessment centers between 2006 and 2010[22]. The UK Biobank has the ethical approval from the North West Multi-center Research Ethics Committee. Informed consent was obtained from each subject or their legal guardians. We used data collected up to March 26, 2021. There were
The participants included in the UK Biobank were invited to complete a touchscreen questionnaire at the local assessment centers. This touchscreen questionnaire included 29 questions about diet, most of which were about the intake frequencies of main foods or food groups, including processed meat, poultry, beef, mutton, pork, oily fish, non-oily fish, cooked vegetables, raw vegetables, fresh fruit, dried fruit, cheese, bread, cereals, tea, water, and alcohol. This questionnaire required the participants to report their average intake of each type of food over the last year. In the current study, we combined two or three foods of the same kind into one food group and then grouped participants into four categories according to the distribution of data following the reported study[24]. The cut-offs for the categories were chosen to ensure a reasonable and similar number of the participants in each group. For example, by combining beef, mutton, and pork into the "Red meat" food group, we then divided the participants into four categories: "< 1 time per week", "1.0–1.9 times per week", "2.0–2.9 times per week", and "≥ 3.0 times per week". In addition, oily fish and non-oily fish were combined into the "Fish" group; cooked vegetables and raw vegetables were combined into the "Vegetables" group; fresh fruit and dried fruit were combined into the "Fruit" group; processed meat and red meat were combined into the "Red and processed meat" group. We divided main foods or food groups into animal (including processed meat, poultry, red meat, red and processed meat, fish, and cheese) and other food groups (fruits, vegetables, bread, cereals, tea, water, and alcohol). The calculation methods and more details of the food groups are shown in Supplementary Table 1 (available online).
In the current study, infectious diseases diagnosed after recruitment (the dietary survey) were defined according to diagnosis records in the UK Biobank, coded by the International Classification of Diseases, version 10 (ICD10) and version 9 (ICD9) (Supplementary Table 2 [available online]). Referring to the coding terms, we identified a total of
In the current study, we additionally categorized the participants into four common diet groups according to their reported consumption of meat and fish following the literature[25]: (1) regular meat-eaters (those who consumed meat including processed meat, red meat, and poultry more than five times a week); (2) low meat-eaters (those who consumed meat less than five times per week); (3) fish-eaters (those who consumed fish but never meat); and (4) vegetarians (those who never consumed any meat or fish). It should be noted that both regular meat-eaters and low meat-eaters may also have a habit of eating fish (consuming fish more than zero times a week).
Continuous variables were presented as mean ± standard deviation or median (quartile) depending on the data distribution, and categorical variables were presented as counts (percentage). The baseline characteristics of the two groups were compared using the unpaired, 2-tailed Student's t-test or Wilcoxon test for continuous variables, and the χ2 test was used for categorical variables.
Multivariable logistic regression was used to estimate associations between infectious diseases and reported intake of food or food groups. We treated sex, age, ethnicity, assessment center, activity, Townsend deprivation index (TDI), and education as covariates, and reported adjusted odds ratios (ORs) with 95% confidence intervals (CIs). Definitions of these covariates are listed in Supplementary Table 3 (available online). Additionally, we treated the dietary exposures as the continuous trend variables in the multivariable logistic models to assess the linear trend.
We conducted a series of sensitivity analyses for infectious diseases. First, we excluded
We also performed a mediation analysis to estimate the proportion mediated by metabolic-related biomarkers (e.g., TG, blood glucose, and HbA1c), immune-related indicator (WBC), nutritional status-related indicators (BMI, BFP, and WHR), and body fat distribution-related indicators (whole body fat mass, arm fat mass, leg fat mass, and trunk fat mass) for the associations between diet groups and infectious diseases. In conducting the mediation analysis, both linear regression and logistic regression were used, and all regression analyses were adjusted for sex, age, ethnicity, assessment center, activity, TDI, and education.
All analyses were performed using R (version 4.1.2, R Foundation for Statistical Computing). P < 0.05 was considered statistically significant.
The current study included
| Variables | Description | All (N= |
P | ||
| Non-infection (n= |
Infection (n= |
||||
| Age [years, n (%)] | <0.000 1 | ||||
| <45 | |||||
| 45–49 | |||||
| 50–54 | |||||
| 55–59 | |||||
| 60–64 | |||||
| ≥65 | |||||
| Male [n (%)] | <0.000 1 | ||||
| White ethnicity or race [n (%)] | < |
||||
| TDI [median (quartile)] | −2.22 (−3.67, 0.35) | −1.66 (−3.39, 1.50) | −2.15 (−3.65, 0.53) | <0.000 1 | |
| BMI [kg/m2, n (%)] | < |
||||
| <18.5 | |||||
| 18.5≤BMI<25 | |||||
| 25≤BMI<30 | |||||
| ≥30 | |||||
| Income [£, n (%)] | < |
||||
| < |
|||||
| |
|||||
| |
|||||
| |
|||||
| > |
|||||
| Education [n (%)] | < |
||||
| Less than high school | |||||
| High school or equivalent | |||||
| College or above | |||||
| Employment [n (%)] | < |
||||
| Adequate exercise [n (%)] | < |
||||
| Smoking status [n (%)] | < |
||||
| Never | |||||
| Previous | |||||
| Current | |||||
| Drinking status [n (%)] | < |
||||
| Never | |||||
| Previous | |||||
| Current | |||||
| The categorical variables are presented as counts (percentage) and compared with the χ2 test between the two groups. The sum of the number of participants in all categories is not equal to the total number because of the missing data. Abbreviation: TDI, Townsend deprivation index. | |||||
 DownLoad:
CSV
DownLoad:
CSV
There were
The participants' characteristics with the lowest and highest consumption of the 13 main food groups are shown in Supplementary Table 4 (available online). The participants who consumed the highest amounts of red and processed meat tended to be current smokers and drinkers, and had a higher BMI than those who consumed the lowest amounts. However, those with the lowest intake of fruits and vegetables were more likely to be current smokers.
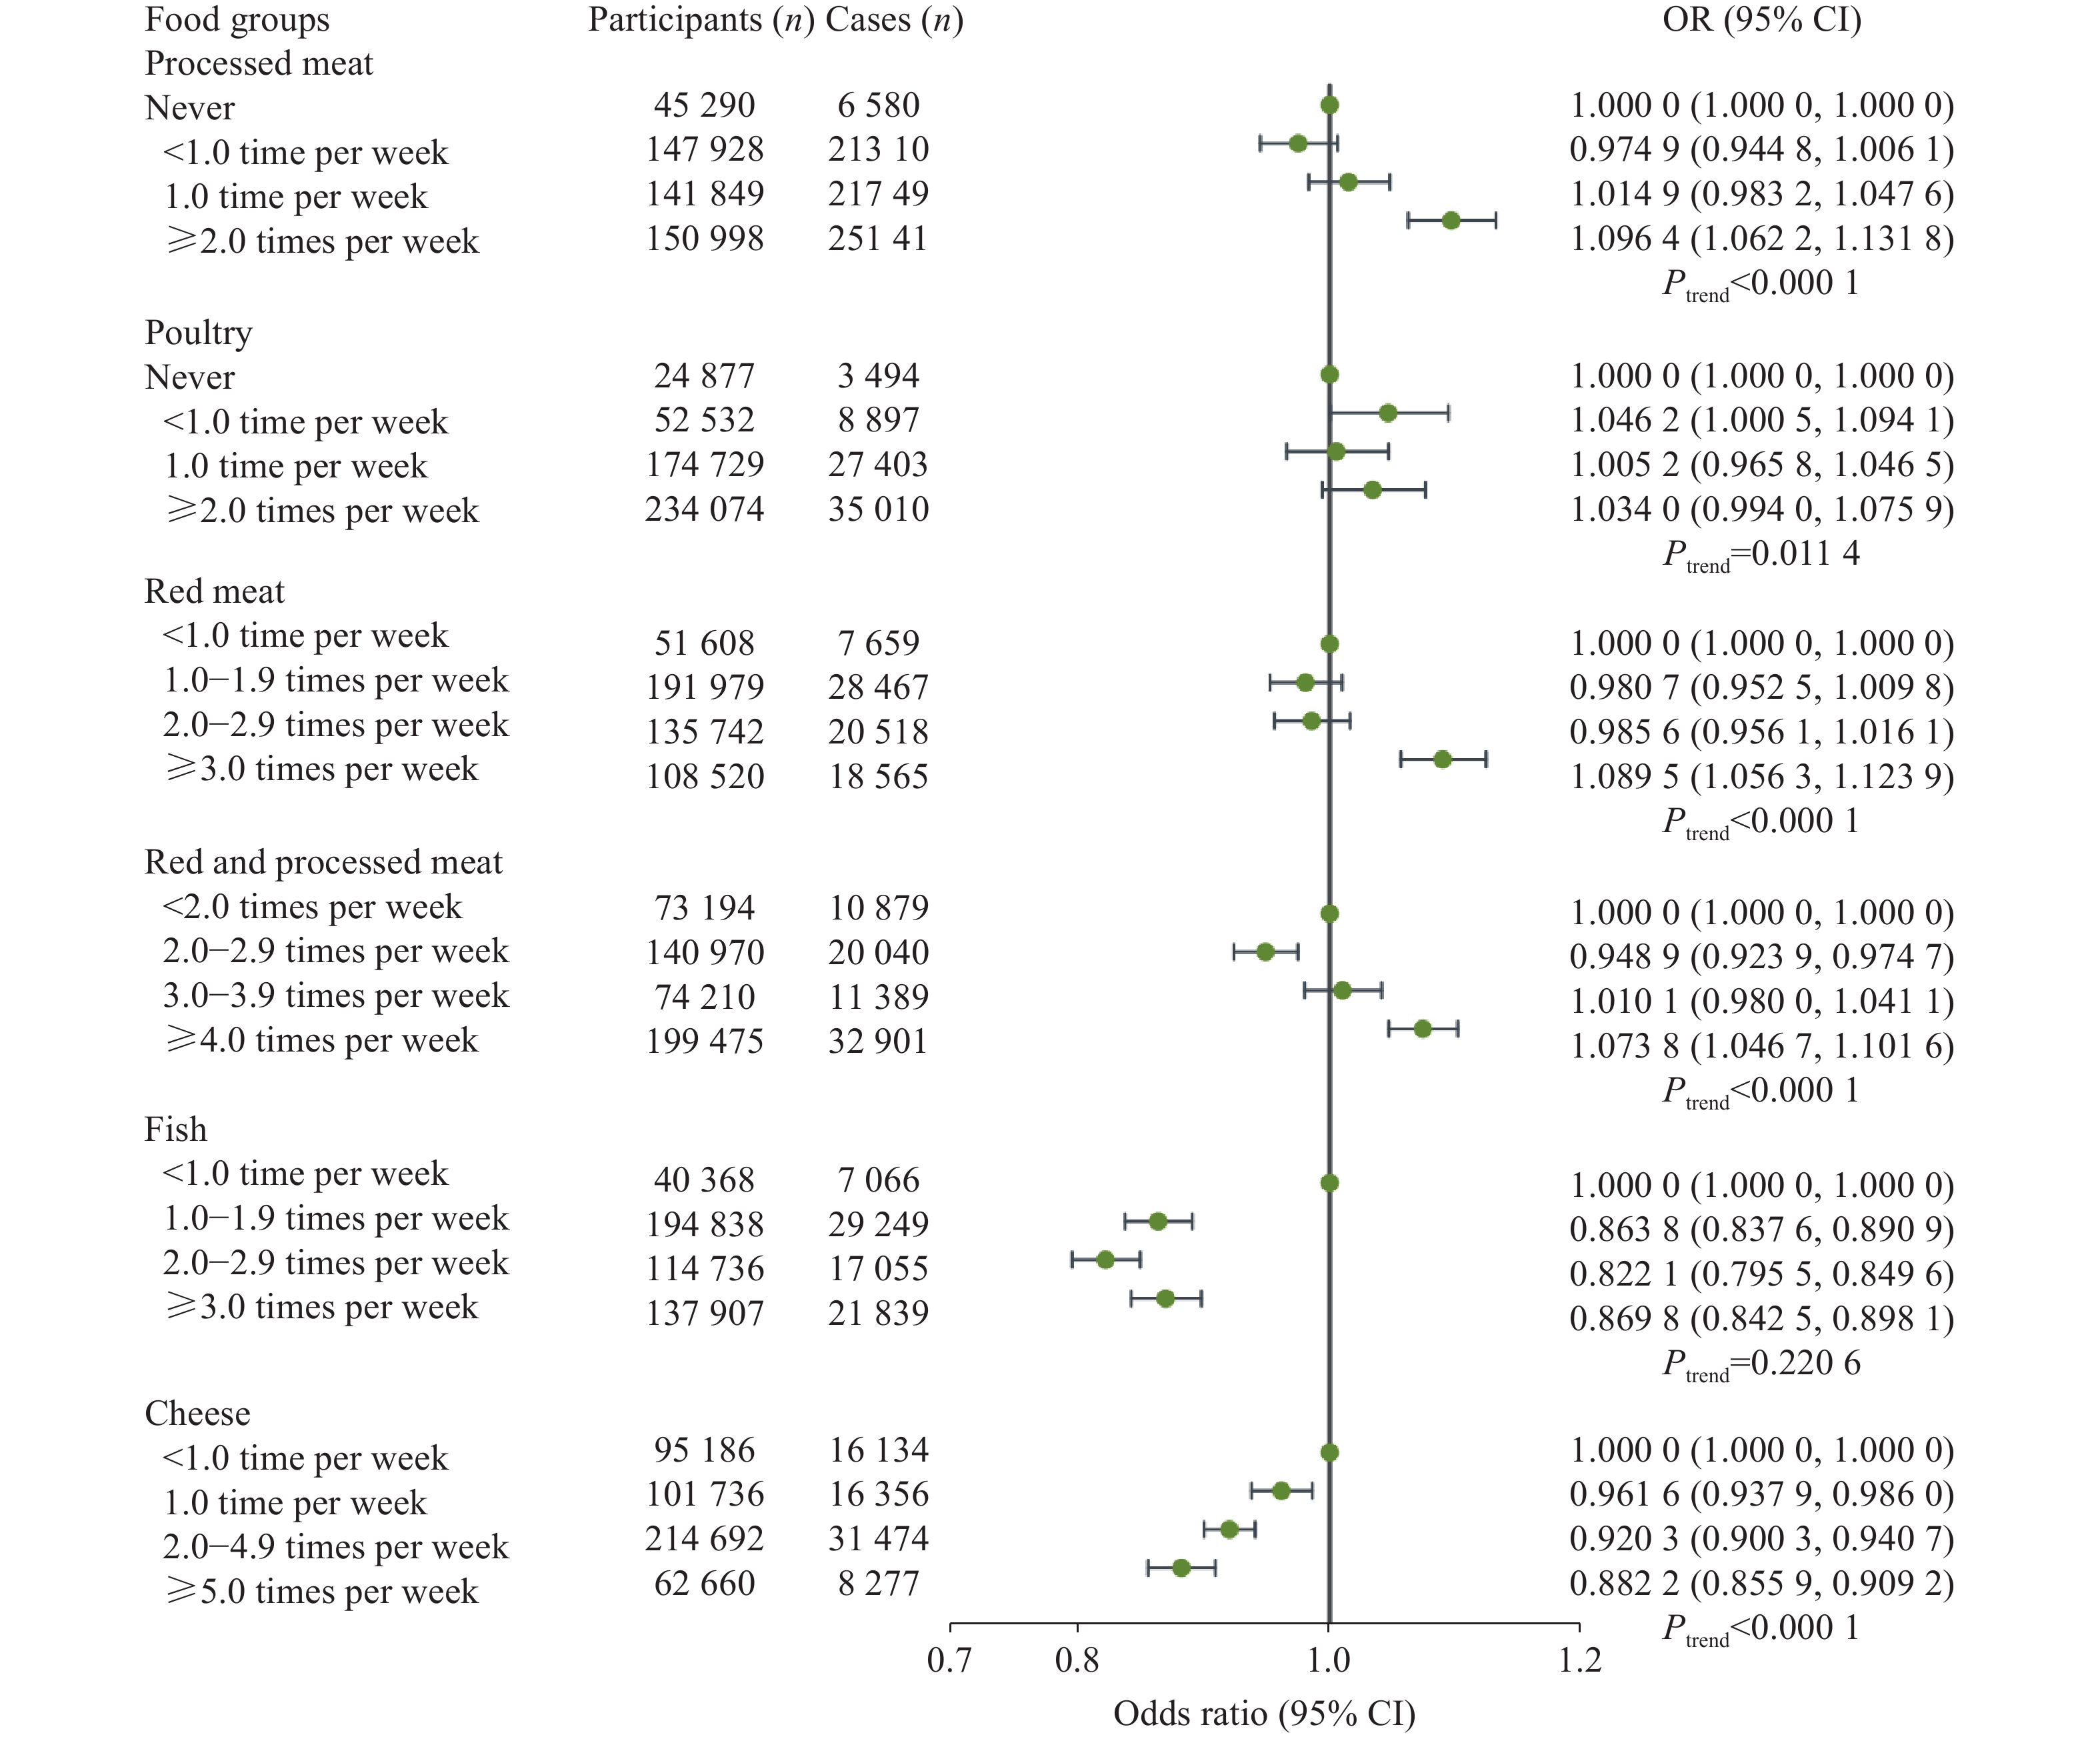
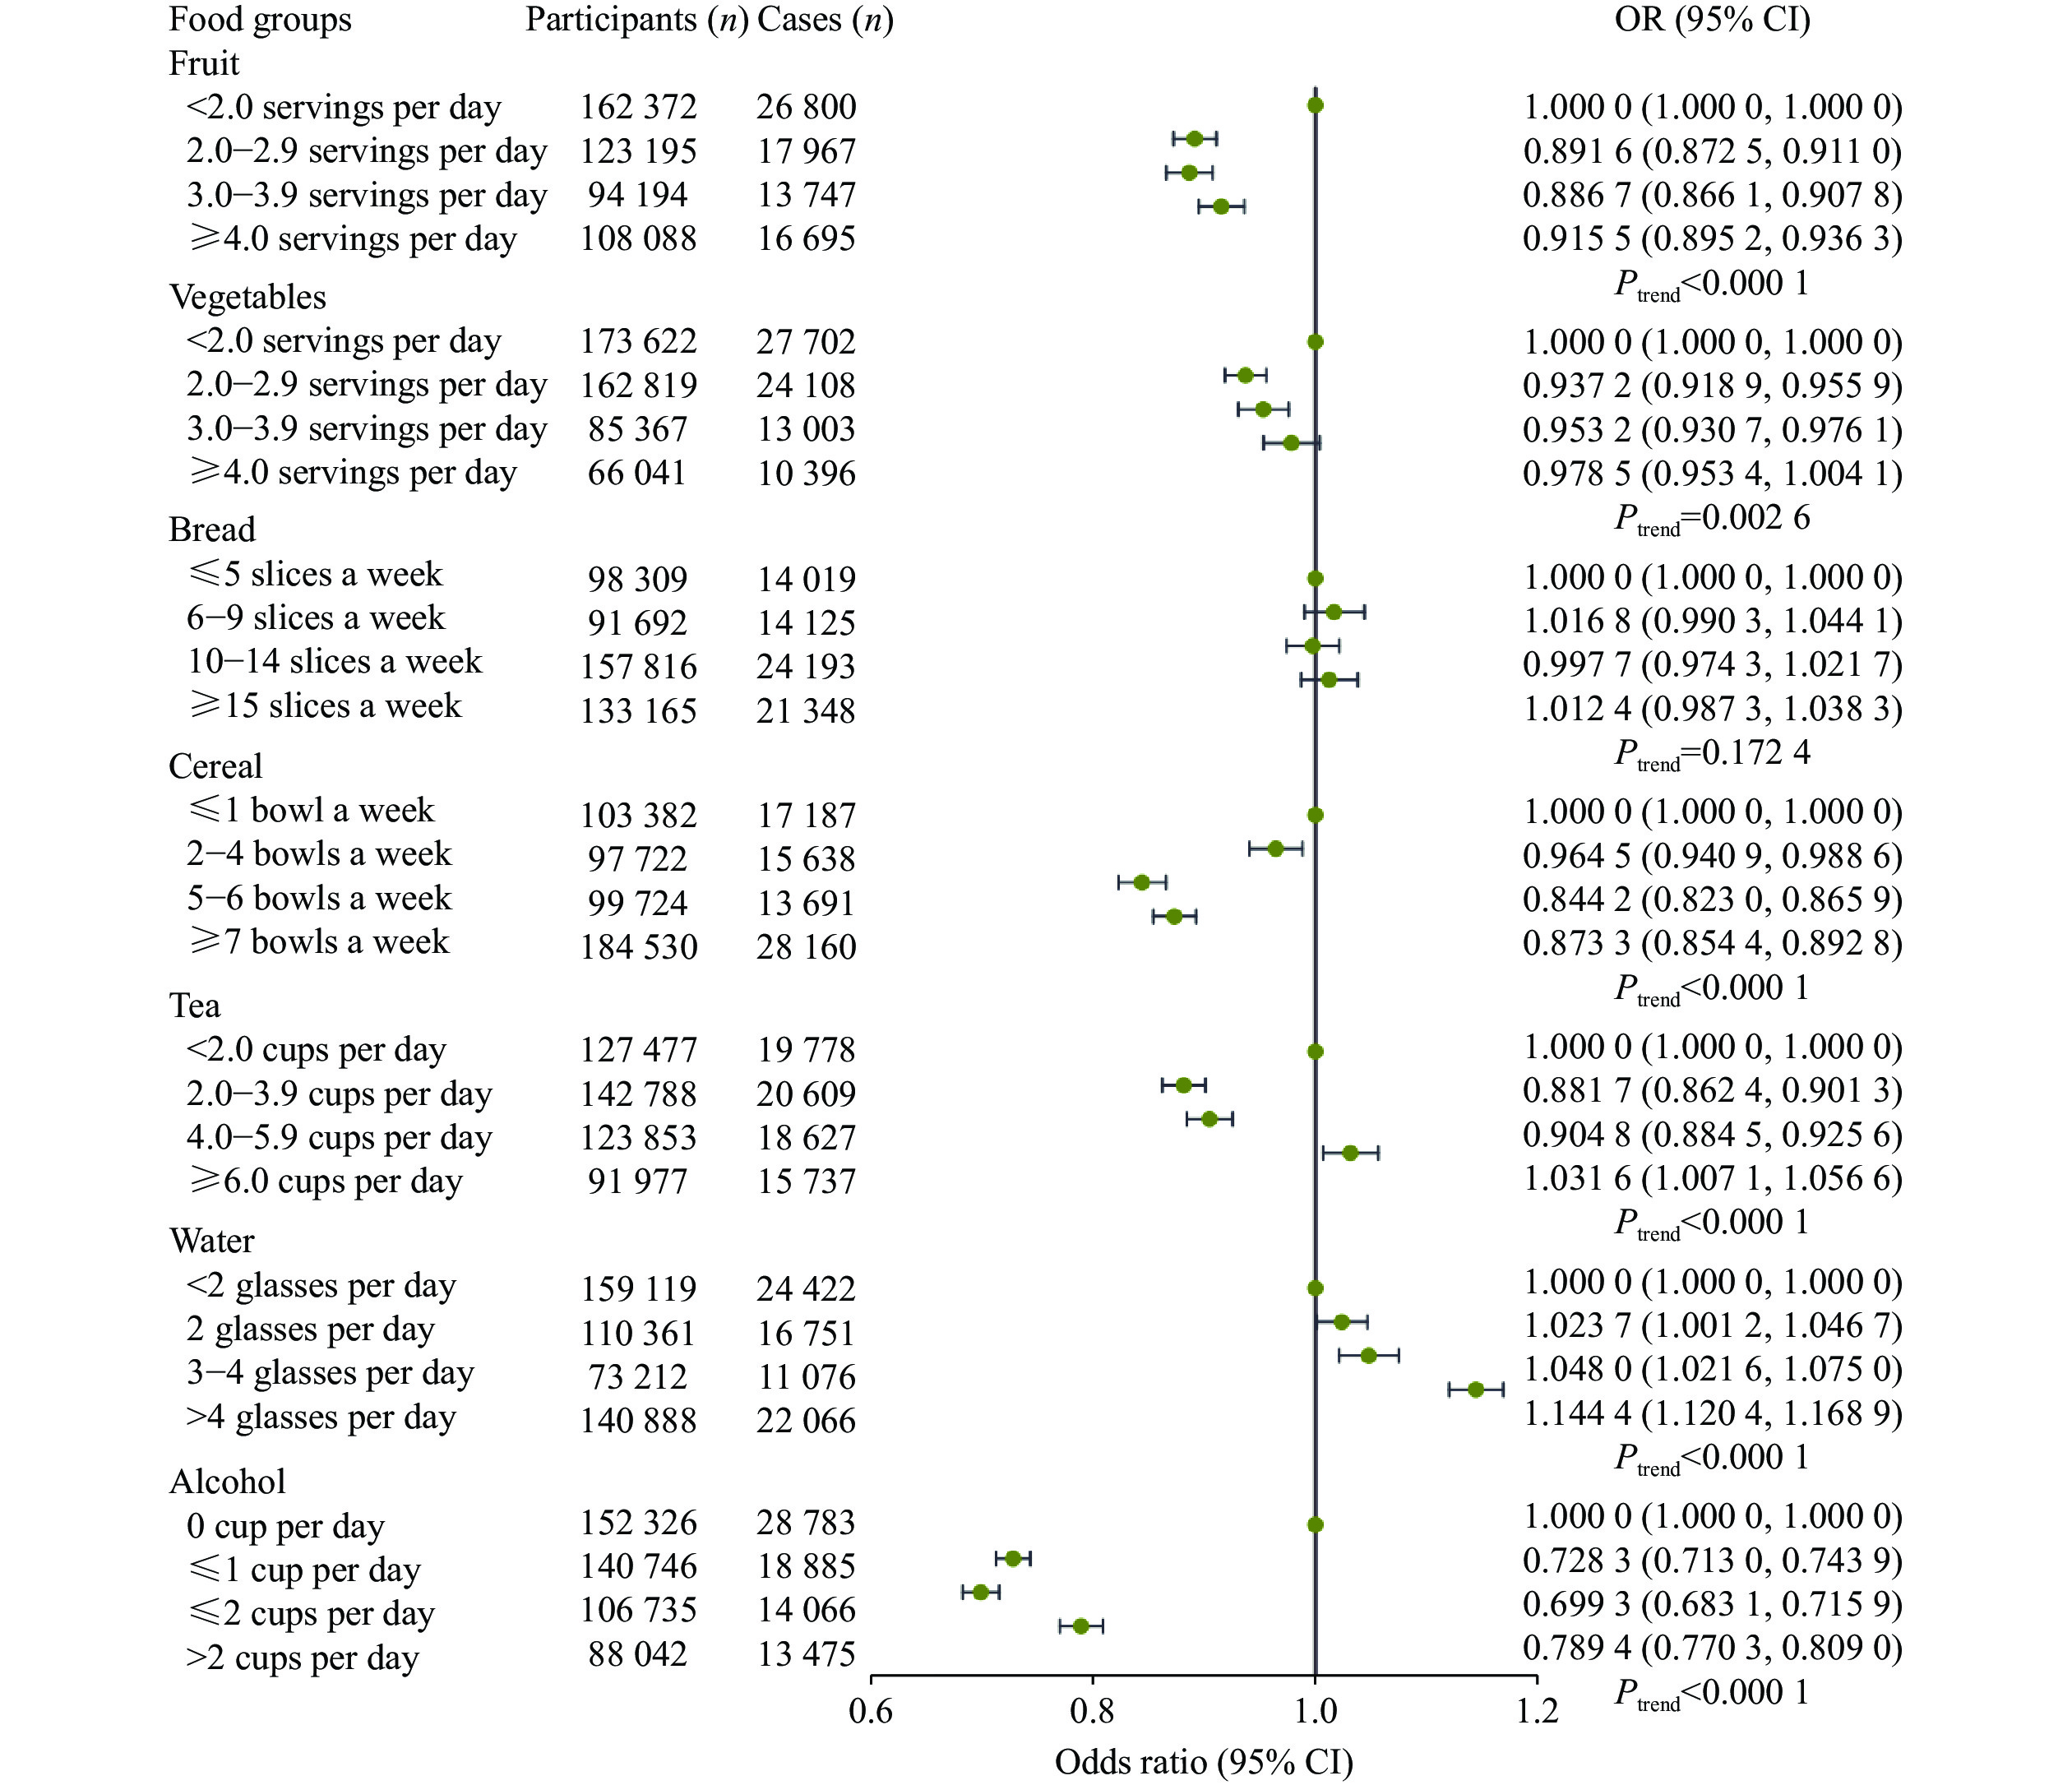
The multivariable associations of the intake of animal and other foods with infectious diseases, adjusted for age, sex, ethnicity, assessment center, activity, TDI, and education, are shown in Fig. 2 and Fig. 3, respectively. For animal foods, the participants with the highest reported intake frequency of processed meat (OR =
When further determining the associations of different types of fish and red meat (as continuous variables) with infectious diseases, we found that the intake of oily fish was negatively correlated with infectious diseases (OR =
For other foods, participants with a higher intake of fruits and cereals (Ptrend <
Furthermore, we also evaluated the above associations in three common types of infectious disease subgroups and obtained results of digestive infectious diseases consistent with the main analysis in terms of the effects of processed meat, red meat, fish, cheese, fruit, vegetables, and alcohol consumption (Supplementary Table 8 [available online]).
First of all, compared with those who had not changed their dietary habits in the past five years, the participants with dietary changes because of illness had a higher risk of infectious diseases (OR =
Second, because one of the most common confounders in epidemiology, sex made a significant difference between infected and non-infected individuals, we conducted a stratified analysis by sex (Table 2). The results for processed meat, red meat, fish, fruit, tea, and alcohol in
| Reported consumptions | Women (N= |
Men (N= |
Pheterogeneity by sex | |||||||
| No | no | OR (95% CI)a | P | No | no | OR (95% CI)a | P | |||
| Processed meat | ||||||||||
| Never | ||||||||||
| <1.0 time per week | ||||||||||
| 1.0 time per week | ||||||||||
| ≥2.0 times per week | < |
|||||||||
| Ptrend< |
Ptrend< |
|||||||||
| Poultry | ||||||||||
| Never | ||||||||||
| <1.0 time per week | ||||||||||
| 1.0 time per week | ||||||||||
| ≥2.0 times per week | ||||||||||
| Ptrend= |
Ptrend= |
|||||||||
| Red meat | ||||||||||
| <1.0 time per week | ||||||||||
| 1.0–1.9 times per week | ||||||||||
| 2.0–2.9 times per week | ||||||||||
| ≥3.0 times per week | < |
|||||||||
| Ptrend< |
Ptrend< |
|||||||||
| Red and processed meat | ||||||||||
| < 2.0 times per week | ||||||||||
| 2.0–2.9 times per week | ||||||||||
| 3.0–3.9 times per week | ||||||||||
| ≥4.0 times per week | < |
|||||||||
| Ptrend< |
Ptrend< |
|||||||||
| Fish | ||||||||||
| <1.0 time per week | ||||||||||
| 1.0–1.9 times per week | < |
< |
||||||||
| 2.0–2.9 times per week | < |
< |
||||||||
| ≥3.0 times per week | < |
< |
||||||||
| Ptrend= |
Ptrend= |
|||||||||
DownLoad:
CSV
| Reported consumptions | Women (N= |
Men (N= |
Pheterogeneity by sex | |||||||
| No | no | OR (95% CI)a | P | No | no | OR (95% CI)a | P | |||
| Cheese | ||||||||||
| <1.0 time per week | ||||||||||
| 1.0 time per week | ||||||||||
| 2.0–4.9 times per week | < |
|||||||||
| ≥5.0 times per week | < |
< |
||||||||
| Ptrend< |
Ptrend< |
|||||||||
| Fruit | ||||||||||
| <2.0 servings per day | ||||||||||
| 2.0–2.9 servings per day | < |
< |
||||||||
| 3.0–3.9 servings per day | < |
< |
||||||||
| ≥4.0 servings per day | < |
|||||||||
| Ptrend< |
Ptrend= |
|||||||||
| Vegetables | ||||||||||
| <2.0 servings per day | ||||||||||
| 2.0–2.9 servings per day | < |
< |
||||||||
| 3.0–3.9 servings per day | ||||||||||
| ≥4.0 servings per day | ||||||||||
| Ptrend= |
Ptrend= |
|||||||||
| Bread | ||||||||||
| ≤5 slices a week | ||||||||||
| 6–9 slices a week | ||||||||||
| 10–14 slices a week | ||||||||||
| ≥15 slices a week | ||||||||||
| Ptrend= |
Ptrend= |
|||||||||
| Cereal | ||||||||||
| ≤1 bowl a week | ||||||||||
| 2–4 bowls a week | ||||||||||
| 5–6 bowls a week | < |
< |
||||||||
| ≥7 bowls a week | < |
< |
||||||||
| Ptrend< |
Ptrend< |
|||||||||
DownLoad:
CSV
| Reported consumptions | Women (N= |
Men (N= |
Pheterogeneity by sex | |||||||
| No | no | OR (95% CI)a | P | No | no | OR (95% CI)a | P | |||
| Tea | ||||||||||
| <2.0 cups per day | ||||||||||
| 2.0–3.9 cups per day | < |
< |
||||||||
| 4.0–5.9 cups per day | < |
< |
||||||||
| ≥6.0 cups per day | ||||||||||
| Ptrend< |
Ptrend= |
|||||||||
| Water | ||||||||||
| <2 glasses per day | ||||||||||
| 2 glasses per day | ||||||||||
| 3–4 glasses per day | ||||||||||
| >4 glasses per day | < |
< |
||||||||
| Ptrend< |
Ptrend< |
|||||||||
| Alcohol | ||||||||||
| 0 cup per day | ||||||||||
| ≤1 cup per day | < |
< |
||||||||
| ≤2 cups per day | < |
< |
||||||||
| >2 cups per day | < |
< |
||||||||
| Ptrend< |
Ptrend= |
|||||||||
| aAdjusted for age, sex, ethnicity, assessment center, activity, Townsend deprivation index, and education. The unequal numbers of groups and each sex are because of the missing data. Abbreviations: No, number of participants; no, number of cases; CI, confidence interval; OR, odds ratio. | ||||||||||
DownLoad:
CSV
Third, considering that dietary habits vary across different races, we also estimated the associations between food groups and infectious diseases in different ethnicity or race, and found that the results for the white ethnicity or race were similar to the main analysis, while those for other ethnicities or races showed quite different results (Supplementary Table 10 [available online]). These results added the evidence to the effects of food groups on the incidence of infectious diseases.
The current study defined
In the mediation analysis, we disclosed the mediation effects of HbA1c and other indicators in the associations observed above. When the mediator was additionally adjusted, the associations were retained (Table 3). For low meat-eaters and fish-eaters, HbA1c mediated a proportion of 17.26% (95% CI: 13.42%–24.18%) and 12.75% (95% CI: 9.21%–21.41%); WBCs mediated a proportion of 24.14% (95% CI: 18.53%–34.1%) and 20.63% (95% CI: 14.37%–32.13%); while BMI mediated a proportion of 53.59% (95% CI: 41.18%–75.45%) and 44.87% (95% CI: 33.01%–73.12%) in these associations, respectively (Fig. 5, Table 3, and Supplementary Table 12 [available online]). TG and indicators related to obesity and body fat distribution mediated the associations of low meat-eaters and fish-eaters (with regular meat-eaters as reference) on infectious diseases.
| Mediators | Exposure | Effect with mediator adjusted (OR with 95% CI)a |
Direct effect (OR with 95% CI)a |
Mediation proportion (%) (95% CI)a |
P |
| TG | Low meat-eaters vs. Ref. | 14.19 (10.43, 20.61) | <0.000 1 | ||
| Fish-eaters vs. Ref. | 7.92 (5.41, 12.68) | < |
|||
| Glucose | Low meat-eaters vs. Ref. | 7.27 (5.21, 10.99) | < |
||
| Fish-eaters vs. Ref. | 0.846 2 (0.791 3, 0.904 0) | 0.980 4 (0.973 7, 0.987 9) | 5.37 (3.63, 8.70) | <0.000 1 | |
| HbA1c | Low meat-eaters vs. Ref. | 0.948 9 (0.932 2, 0.965 9) | 0.993 5 (0.991 3, 0.995 7) | 17.26 (13.42, 24.18) | <0.000 1 |
| Fish-eaters vs. Ref. | 0.871 0 (0.817 1, 0.927 5) | 0.983 6 (0.977 2, 0.990 7) | 12.75 (9.21, 21.41) | <0.000 1 | |
| WBC | Low meat-eaters vs. Ref. | 0.954 5 (0.937 9, 0.971 4) | 0.994 2 (0.992 2, 0.996 4) | 24.14 (18.53, 34.1) | <0.000 1 |
| Fish-eaters vs. Ref. | 0.876 2 (0.822 5, 0.932 6) | 0.984 3 (0.977 5, 0.991 3) | 20.63 (14.37, 32.13) | <0.000 1 | |
| BMI | Low meat-eaters vs. Ref. | 0.972 5 (0.955 7, 0.989 6) | 0.996 5 (0.994 3, 0.998 7) | 53.59 (41.18, 75.45) | <0.000 1 |
| Fish-eaters vs. Ref. | 0.911 6 (0.856 1, 0.969 8) | 0.989 3 (0.982 8, 0.996 7) | 44.87 (33.01, 73.12) | <0.000 1 | |
| WHR | Low meat-eaters vs. Ref. | 0.970 3 (0.953 6, 0.987 3) | 0.996 3 (0.994 3, 0.998 4) | 50.41 (39.72, 70.67) | <0.000 1 |
| Fish-eaters vs. Ref. | 0.900 9 (0.846 3, 0.958 3) | 0.987 7 (0.980 1, 0.995 1) | 36.57 (25.73, 59.84) | <0.000 1 | |
| Body fat percentage | Low meat-eaters vs. Ref. | 0.968 1 (0.951 2, 0.985 2) | 0.996 0 (0.994 0, 0.998 1) | 49.26 (38.37, 67.43) | <0.000 1 |
| Fish-eaters vs. Ref. | 0.917 5 (0.861 3, 0.976 5) | 0.989 9 (0.982 4, 0.997 1) | 47.39 (33.09, 77.04) | <0.000 1 | |
| Whole body fat mass | Low meat-eaters vs. Ref. | 0.971 7 (0.954 8, 0.989 0) | 0.996 5 (0.994 3, 0.998 7) | 53.45 (41.84, 76.09) | <0.000 1 |
| Fish-eaters vs. Ref. | 0.919 1 (0.862 8, 0.978 3) | 0.990 0 (0.983 2, 0.997 5) | 46.87 (33.30, 77.84) | <0.000 1 | |
| Arms fat mass | Low meat-eaters vs. Ref. | 0.964 5 (0.948 0, 0.981 4) | 0.995 5 (0.993 3, 0.997 6) | 39.69 (30.44, 55.78) | <0.000 1 |
| Fish-eaters vs. Ref. | 0.893 2 (0.839 2, 0.949 9) | 0.986 6 (0.979 5, 0.993 8) | 31.54 (22.82, 51.12) | <0.000 1 | |
| Leg fat mass | Low meat-eaters vs. Ref. | 0.961 4 (0.944 9, 0.978 2) | 0.995 2 (0.993 1, 0.997 4) | 34.99 (26.95, 51.17) | <0.000 1 |
| Fish-eaters vs. Ref. | 0.887 9 (0.834 2, 0.944 2) | 0.986 1 (0.979 3, 0.993 4) | 28.44 (20.15, 47.18) | <0.000 1 | |
| Trunk fat mass | Low meat-eaters vs. Ref. | 0.969 1 (0.952 2, 0.986 3) | 0.996 1 (0.993 9, 0.998 2) | 49.49 (38.15, 68.13) | <0.000 1 |
| Fish-eaters vs. Ref. | 0.910 7 (0.855 0, 0.969 2) | 0.989 3 (0.982 3, 0.995 9) | 42.58 (30.17, 66.34) | <0.000 1 | |
| aAdjusted for age, sex, ethnicity, assessment center, activity, Townsend deprivation index, and education.Abbreviations: CI, confidence interval; OR, odds ratio; TG, total cholesterol; WBC, white blood cells; BMI, body mass index; WHR, waist-to-hip ratio. | |||||
DownLoad:
CSV
In this large-scale contemporary study, we conducted comprehensive analyses to investigate the associations between diet and infectious diseases, and found that the consumption frequency of different food groups was associated with the risk of infection. A series of sensitivity analyses were performed to confirm the main results. Diet groups were also associated with the risk of infectious diseases, and HbA1c, WBC, and BMI may mediate the observed significant associations.
Investigators have been unanimously concerned about the health effects of meat consumption[24,26]. Nowadays, people pay increasing attention to a balanced diet. The extensive consumption of meat may replace the consumption of other foods, such as vegetables, and result in changes to meal composition. In addition, Europeans have a habit of consuming raw meat like medium-rare steak, and the increased frequency of raw meat intake increases exposure to pathogens, contributing to the high risk of digestive infectious diseases[27]. These findings are consistent with the current study that the higher meat consumption may be associated with a higher risk of digestive infectious diseases. Furthermore, our results showed that moderate meat consumption reduced the risk of infection, and we suspect that the reason may be because of the fact that eating meat in small amounts helps the body replenish nutrients like protein, lipids, and minerals[28]. Fish, as one of the most important sources of omega-3 polyunsaturated fatty acids, is associated with various health benefits. A meta-analysis of prospective cohort studies indicated that higher fish consumption might reduce all-cause mortality[29–30]. Our results showed that a higher intake of fish, especially oily fish, was associated with a lower risk of infectious diseases, providing further evidence that fish intake has health benefits. Cheese, a fresh or matured food obtained from the coagulation of milk, is rich in nutritional components, such as proteins, bioactive proteins, amino acids, minerals, and vitamins[31]. In the current study, we found that a higher frequency of cheese consumption was positively associated with a lower risk of infectious diseases, in both women and men. Consuming cheese more than five times a week may be recommended to reduce the infectious risk based on the current results. Nevertheless, this may also be attributed to the common practice of consuming cheese with fresh foods.
Dietary guidelines worldwide recommend consuming more fruits and vegetables, which are rich in vitamins, minerals, dietary fiber, and a variety of phytochemicals to maintain health[32]. In the current study, we separately investigated the associations of fruits and vegetables with infectious diseases, and found that a daily intake of 3.0–3.9 servings of fruit and 2.0–2.9 servings of vegetables was associated with a lower risk of infectious diseases. These findings are consistent with a meta-analysis of 26 cohort studies, which found that five or more servings of fruits and vegetables per day were associated with less damage to health[33].
Bread and cereal are staple foods of Europeans. Whole grain bread offers advantages over other types of bread, which may be related to the ingredients, processing technology, and edible methods[34–35]. Tea, as a pleasant, popular, and socially accepted drink, is the richest source of a class of antioxidants called flavonoids and has the function of preventing intestinal flora infection and enhancing body immunity[36]. Combining the above evidence and our findings, moderate drinking of tea (2.0–3.9 cups daily) is worth advocating, but excessive tea intake increases disease risk, which may be related to the inhibition of essential trace elements.
An intriguing trend was observed in the current study, where individuals consuming more than four glasses of water per day exhibited a higher risk of infection than those consuming fewer than two glasses. Based on the literature, we posited the following potential reasons: although in developed countries, there were millions of cases of waterborne infections each year[37–38]. Water intake is associated with the opportunity for exposure to pathogens in drinking water, where there may be over 500 types of waterborne pathogens. Despite strict management of drinking water quality being accessible in developed countries, it may not screen for fungi, algae, protozoa, and less significant bacteria, which leads to pathogens or organisms entering households through water as a medium of transmission. Additionally, the aging of drinking water treatment or distribution systems may also result in pathogen invasion[39–40]. Furthermore, areas with poor water quality often coincide with dense populations, lower economies, and other social factors, which may be associated with respiratory infections, sexually transmitted diseases, and other issues[38].
In general, after being ill, changing dietary habits is the common non-drug treatment to adjust the body status or prevent the disease progression; however, it may lead to a selection bias of participants[41]. The current study took this bias into consideration by excluding those participants who reported having made major changes in the past five years because of illness, and the results were consistent with those before the exclusion, indicating that the associations between diet and infectious diseases were valid.
We observed a sex-based heterogeneity in the associations of poultry, red meat, red and processed meat, fish, and fruit with infectious diseases. While these differences may not be clearly explained now, they indicate that the effect of sex on infectious diseases should not be ignored. There is evidence that the pathogen-induced immune responses are significantly influenced by the host's sex in many instances, and several genes have been observed to affect susceptibility to viruses, bacteria, parasites, fungi, and worms[42].
Ethnicity is another important social determinant of infectious diseases besides sex[43]. Our findings of the white ethnicity were aligned with the main results, while there were fewer associations in the Asian or African group. Such differences may be linked to genetic factors and immune responses, or it may have been difficult to detect those associations in a limited sample size.
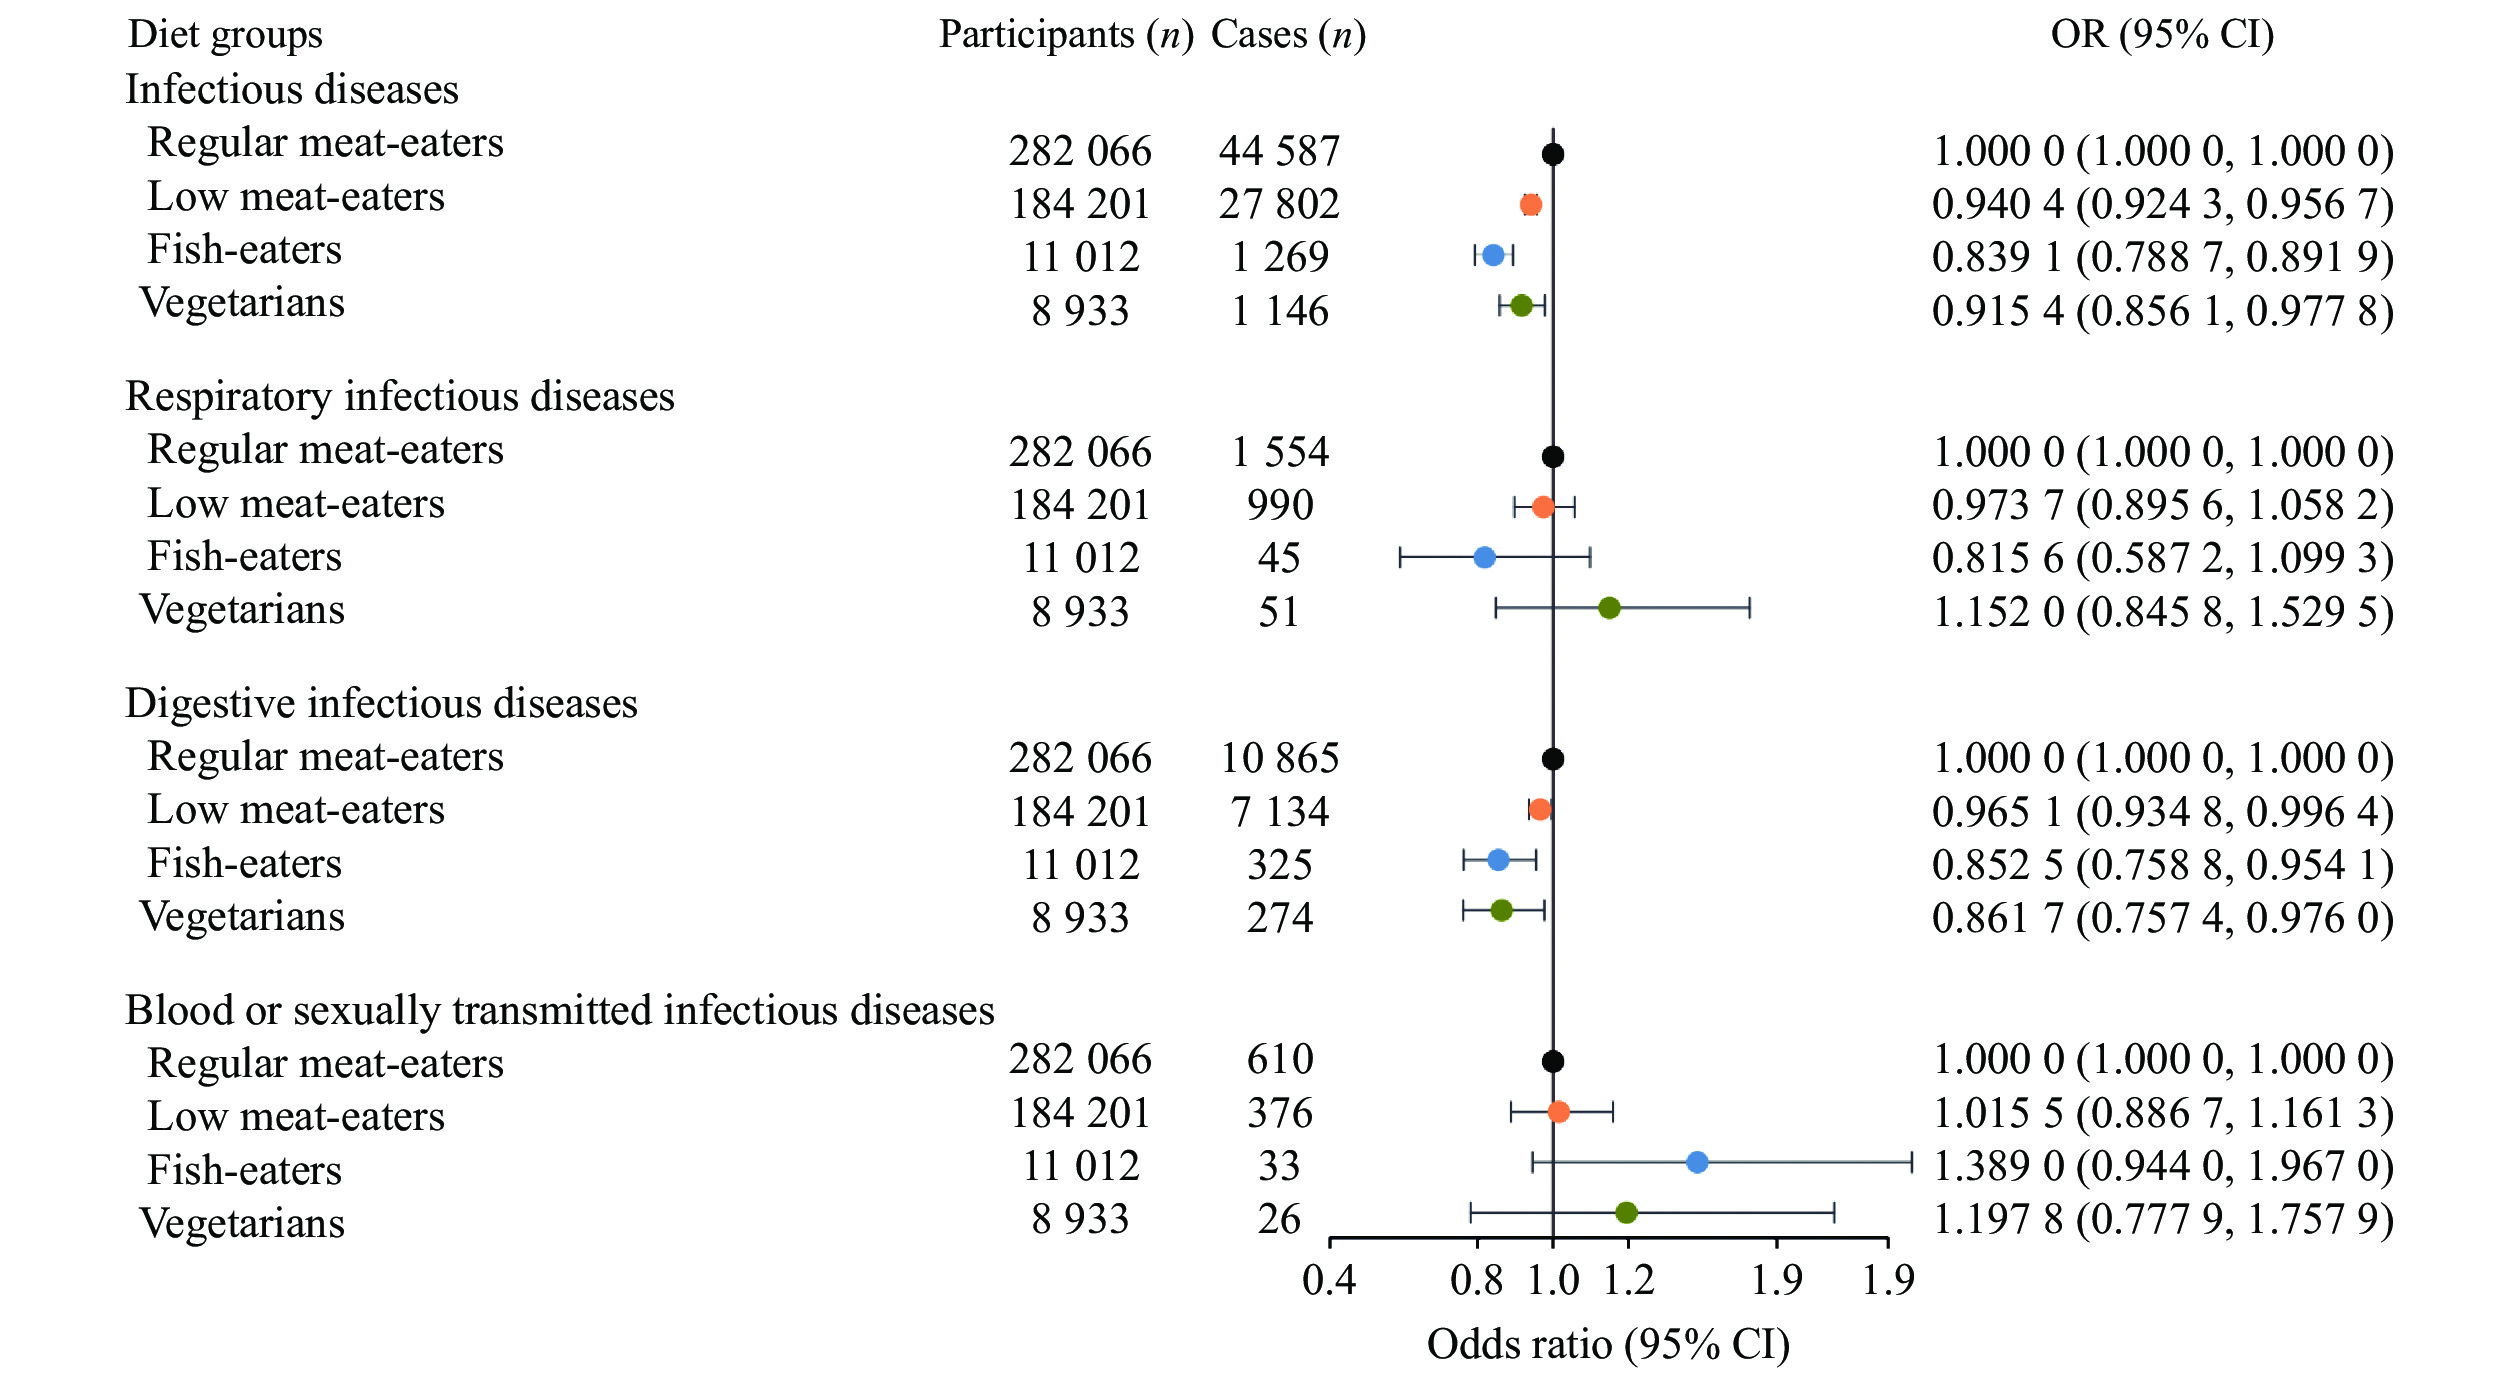
Compared with the regular meat-eaters, the low meat-eaters, fish-eaters, and vegetarians had a lower risk of infectious diseases, suggesting that dietary preferences of meat and fish indeed influence the infection risk. Further analysis disclosed the mediation effects of nutritional status-related indicators such as BMI/BFP, metabolic-related indicators such as HbA1c, and immune-related indicators such as WBC in the above-mentioned associations. According to the findings, we speculate that several aspects mentioned above may be potential factors or pathways influencing the risk of infectious diseases because of dietary influences. Among these mediators, the intermediate effect values of nutrition-related indicators are relatively significant. This suggests that it may be possible to reduce the risk of infectious diseases by adjusting the overall nutritional status of the population through the establishment of healthy dietary habits.
Nonetheless, the current study has several limitations. First, although we defined the dietary factors using the baseline survey data to help us confirm the intake of food groups, the eating habits of participants may change before suffering from infectious diseases, which may lead to inaccurately estimated associations between diet and infections. Second, the dietary data coming from the questionnaire was self-reported, which may have produced measurement errors and bias. Third, the current study focused on the frequency of food groups, and because of the lack of uniform standards for quantifying, the estimated associations between diet and infectious diseases may be biased. Fourth, because of variations in recurrence rates among different infectious diseases and the lack of practical significance in aggregating disease frequencies, the current study did not analyze the specific associations between diet and each infectious disease individually. However, future exploration and validation of such associations through alternative approaches, such as animal experiments, may be necessary.
This work was supported by the National Natural Science Foundation of China (Grant Nos. 82173585 and 82273741), the Natural Science Foundation of Jiangsu Higher Education Institutions of China (Grant Nos. 21KJB330005 and 22KJB330007), the Nanjing Major Science and Technology Project (Grant No. 2021-11005), and the Priority Academic Program Development of Jiangsu Higher Education Institutions.
The current study was conducted using UK Biobank resources under Application Number 67665 (http://www.ukbiobank.ac.uk). We sincerely thank the participants and investigators of the UK Biobank for providing us with the publicly available data used in the current research.
CLC number: R155.3, Document code: A
The authors reported no conflict of interests.
| [1] |
Strich JR, Chertow DS. CRISPR-cas biology and its application to infectious diseases[J]. J Clin Microbiol, 2019, 57(4): e01307–18. doi: 10.1128/jcm.01307-18
|
| [2] |
De Martel C, Georges D, Bray F, et al. Global burden of cancer attributable to infections in 2018: a worldwide incidence analysis[J]. Lancet Glob Health, 2020, 8(2): e180–e190. doi: 10.1016/S2214-109X(19)30488-7
|
| [3] |
Gao Z, Xu Y, Sun C, et al. A systematic review of asymptomatic infections with COVID-19[J]. J Microbiol Immunol Infect, 2021, 54(1): 12–16. doi: 10.1016/j.jmii.2020.05.001
|
| [4] |
Nii-Trebi NI. Emerging and neglected infectious diseases: insights, advances, and challenges[J]. Biomed Res Int, 2017, 2017: 5245021. https://www.hindawi.com/journals/bmri/2017/5245021/
|
| [5] |
Ye X, Wang Y, Zou Y, et al. Associations of socioeconomic status with infectious diseases mediated by lifestyle, environmental pollution and chronic comorbidities: a comprehensive evaluation based on UK Biobank[J]. Infect Dis Poverty, 2023, 12(1): 5. doi: 10.1186/s40249-023-01056-5
|
| [6] |
Liu Q, Xu W, Lu S, et al. Landscape of emerging and re-emerging infectious diseases in China: impact of ecology, climate, and behavior[J]. Front Med, 2018, 12(1): 3–22. doi: 10.1007/s11684-017-0605-9
|
| [7] |
GBD 2017 Diet Collaborators. Health effects of dietary risks in 195 countries, 1990–2017: a systematic analysis for the Global Burden of Disease Study 2017[J]. Lancet, 2019, 393(10184): 1958–1972. doi: 10.1016/S0140-6736(19)30041-8
|
| [8] |
Key TJ, Bradbury KE, Perez-Cornago A, et al. Diet, nutrition, and cancer risk: what do we know and what is the way forward?[J]. BMJ, 2020, 368: m511. doi: 10.1136/bmj.m996
|
| [9] |
Zinöcker MK, Lindseth IA. The western diet-microbiome-host interaction and its role in metabolic disease[J]. Nutrients, 2018, 10(3): 365. doi: 10.3390/nu10030365
|
| [10] |
Chao AM, Quigley KM, Wadden TA. Dietary interventions for obesity: clinical and mechanistic findings[J]. J Clin Invest, 2021, 131(1): e140065. doi: 10.1172/JCI140065
|
| [11] |
Pazoki R, Dehghan A, Evangelou E, et al. Genetic predisposition to high blood pressure and lifestyle factors: associations with midlife blood pressure levels and cardiovascular events[J]. Circulation, 2018, 137(7): 653–661. doi: 10.1161/CIRCULATIONAHA.117.030898
|
| [12] |
Merino J, Joshi AD, Nguyen LH, et al. Diet quality and risk and severity of COVID-19: a prospective cohort study[J]. Gut, 2021, 70(11): 2096–2104. doi: 10.1136/gutjnl-2021-325353
|
| [13] |
Weiss JJ, Sanchez L, Hubbard J, et al. Diet quality is low and differs by sex in people with HIV[J]. J Nutr, 2019, 149(1): 78–87. doi: 10.1093/jn/nxy241
|
| [14] |
Pfeiffer AFH, Pedersen E, Schwab U, et al. The effects of different quantities and qualities of protein intake in people with diabetes mellitus[J]. Nutrients, 2020, 12(2): 365. doi: 10.3390/nu12020365
|
| [15] |
Ludwig DS, Hu FB, Tappy L, et al. Dietary carbohydrates: role of quality and quantity in chronic disease[J]. BMJ, 2018, 361: k2340. doi: 10.1136/bmj.k2340
|
| [16] |
Kaelin Jr WG, Mcknight SL. Influence of metabolism on epigenetics and disease[J]. Cell, 2013, 153(1): 56–69. doi: 10.1016/j.cell.2013.03.004
|
| [17] |
Li X, Li C, Shang D, et al. The implications of relationships between human diseases and metabolic subpathways[J]. PLoS One, 2011, 6(6): e21131. doi: 10.1371/journal.pone.0021131
|
| [18] |
Di Renzo L, Gualtieri P, Romano L, et al. Role of personalized nutrition in chronic-degenerative diseases[J]. Nutrients, 2019, 11(8): 1707. doi: 10.3390/nu11081707
|
| [19] |
Smith TJ, McClung JP. Nutrition, immune function, and infectious disease[J]. Med J (Ft Sam Houst Tex), 2021, (PB 8-21-01/02/03): 133–136.
|
| [20] |
Park S, Zhang T. A positive association of overactivated immunity with metabolic syndrome risk and mitigation of its association by a plant-based diet and physical activity in a large cohort study[J]. Nutrients, 2021, 13(7): 2308. doi: 10.3390/nu13072308
|
| [21] |
Mullard A. The UK biobank at 20[J]. Nat Rev Drug Discov, 2022, 21(9): 628–629. doi: 10.1038/d41573-022-00137-8
|
| [22] |
Sudlow C, Gallacher J, Allen N, et al. UK biobank: an open access resource for identifying the causes of a wide range of complex diseases of middle and old age[J]. PLoS Med, 2015, 12(3): e1001779. doi: 10.1371/journal.pmed.1001779
|
| [23] |
Yang S, Zhou X. Accurate and scalable construction of polygenic scores in large biobank data sets[J]. Am J Hum Genet, 2020, 106(5): 679–693. doi: 10.1016/j.ajhg.2020.03.013
|
| [24] |
Bradbury KE, Murphy N, Key TJ. Diet and colorectal cancer in UK Biobank: a prospective study[J]. Int J Epidemiol, 2020, 49(1): 246–258. doi: 10.1093/ije/dyz064
|
| [25] |
Watling CZ, Schmidt JA, Dunneram Y, et al. Risk of cancer in regular and low meat-eaters, fish-eaters, and vegetarians: a prospective analysis of UK Biobank participants[J]. BMC Med, 2022, 20(1): 73. doi: 10.1186/s12916-022-02256-w
|
| [26] |
Chung MG, Li Y, Liu J. Global red and processed meat trade and non-communicable diseases[J]. BMJ Glob Health, 2021, 6(11): e006394. doi: 10.1136/bmjgh-2021-006394
|
| [27] |
Boxman ILA, Jansen CCC, Zwartkruis-Nahuis AJT, et al. Detection and quantification of hepatitis E virus RNA in ready to eat raw pork sausages in the netherlands[J]. Int J Food Microbiol, 2020, 333: 108791. doi: 10.1016/j.ijfoodmicro.2020.108791
|
| [28] |
Scollan ND, Price EM, Morgan SA, et al. Can we improve the nutritional quality of meat?[J]. Proc Nutr Soc, 2017, 76(4): 603–618. doi: 10.1017/S0029665117001112
|
| [29] |
Jurek J, Owczarek M, Godos J, et al. Fish and human health: an umbrella review of observational studies[J]. Int J Food Sci Nutr, 2022, 73(7): 851–860. doi: 10.1080/09637486.2022.2090520
|
| [30] |
Byrd KA, Shieh J, Mork S, et al. Fish and fish-based products for nutrition and health in the first
|
| [31] |
Santiago-López L, Aguilar-Toalá JE, Hernández-Mendoza A, et al. Invited review: bioactive compounds produced during cheese ripening and health effects associated with aged cheese consumption[J]. J Dairy Sci, 2018, 101(5): 3742–3757. doi: 10.3168/jds.2017-13465
|
| [32] |
Herforth A, Arimond M, Álvarez-Sánchez C, et al. A global review of food-based dietary guidelines[J]. Adv Nutr, 2019, 10(4): 590–605. doi: 10.1093/advances/nmy130
|
| [33] |
Wang DD, Li Y, Bhupathiraju SN, et al. Fruit and vegetable intake and mortality: results from 2 prospective cohort studies of us men and women and a meta-analysis of 26 cohort studies[J]. Circulation, 2021, 143(17): 1642–1654. doi: 10.1161/CIRCULATIONAHA.120.048996
|
| [34] |
Torbica A, Radosavljević M, Belović M, et al. Overview of nature, frequency and technological role of dietary fibre from cereals and pseudocereals from grain to bread[J]. Carbohydr Polym, 2022, 290: 119470. doi: 10.1016/j.carbpol.2022.119470
|
| [35] |
Weegels PL. The future of bread in view of its contribution to nutrient intake as a starchy staple food[J]. Plant Foods Hum Nutr, 2019, 74(1): 1–9. doi: 10.1007/s11130-019-0713-6
|
| [36] |
Ng KW, Cao ZJ, Chen HB, et al. Oolong tea: a critical review of processing methods, chemical composition, health effects, and risk[J]. Crit Rev Food Sci Nutr, 2018, 58(17): 2957–2980. doi: 10.1080/10408398.2017.1347556
|
| [37] |
Gerdes ME, Miko S, Kunz JM, et al. Estimating waterborne infectious disease burden by exposure route, United States, 2014[J]. Emerg Infect Dis, 2023, 29(7): 1357–1366. doi: 10.3201/eid2907.230231
|
| [38] |
Jena S, Gaur D, Dubey NC, et al. Advances in paper based isothermal nucleic acid amplification tests for water-related infectious diseases[J]. Int J Biol Macromol, 2023, 242(Pt 3): 125089. doi: 10.1016/j.ijbiomac.2023.125089
|
| [39] |
Ashbolt NJ. Microbial contamination of drinking water and human health from community water systems[J]. Curr Environ Health Rep, 2015, 2(1): 95–106. doi: 10.1007/s40572-014-0037-5
|
| [40] |
Novak Babič M, Gostinčar C, Gunde-Cimerman N. Microorganisms populating the water-related indoor biome[J]. Appl Microbiol Biotechnol, 2020, 104(15): 6443–6462. doi: 10.1007/s00253-020-10719-4
|
| [41] |
Cederholm T, Barazzoni R, Austin P, et al. ESPEN guidelines on definitions and terminology of clinical nutrition[J]. Clin Nutr, 2017, 36(1): 49–64. doi: 10.1016/j.clnu.2016.09.004
|
| [42] |
Dhakal S, Chaulagain S, Klein SL. Sex biases in infectious diseases research[J]. J Exp Med, 2022, 219(6): e20211486. doi: 10.1084/jem.20211486
|
| [43] |
Jenks JD, Aneke CI, Al-Obaidi MM, et al. Race and ethnicity: risk factors for fungal infections?[J]. PLoS Pathog, 2023, 19(1): e1011025. doi: 10.1371/journal.ppat.1011025
|
| 1. | Hosseinzadeh A, Pourhanifeh MH, Amiri S, et al. Therapeutic potential of melatonin in targeting molecular pathways of organ fibrosis. Pharmacol Rep, 2023. DOI:10.1007/s43440-023-00554-5. Online ahead of print |
| 2. | Luo Q, Cai Y, Zhao Q, et al. Renal Protective Effects of Melatonin in Animal Models of Diabetes Mellitus-Related Kidney Damage: A Systematic Review and Meta-Analysis. J Diabetes Res, 2022, 2022: 3770417. DOI:10.1155/2022/3770417 |
| 3. | Hsiao CC, Hou YS, Liu YH, et al. Combined Melatonin and Extracorporeal Shock Wave Therapy Enhances Podocyte Protection and Ameliorates Kidney Function in a Diabetic Nephropathy Rat Model. Antioxidants (Basel), 2021, 10(5): 733. DOI:10.3390/antiox10050733 |
| 4. | Pourhanifeh MH, Hosseinzadeh A, Dehdashtian E, et al. Melatonin: new insights on its therapeutic properties in diabetic complications. Diabetol Metab Syndr, 2020, 12: 30. DOI:10.1186/s13098-020-00537-z |
| 5. | Shi S, Lei S, Tang C, et al. Melatonin attenuates acute kidney ischemia/reperfusion injury in diabetic rats by activation of the SIRT1/Nrf2/HO-1 signaling pathway. Biosci Rep, 2019, 39(1): BSR20181614. DOI:10.1042/BSR20181614. Print 2019 Jan 31 |
| 6. | Prado NJ, Ferder L, Manucha W, et al. Anti-Inflammatory Effects of Melatonin in Obesity and Hypertension. Curr Hypertens Rep, 2018, 20(5): 45. DOI:10.1007/s11906-018-0842-6 |
Figures(5) / Tables(5)
Supported by: Beijing Renhe Information Technology Co., Ltd. E-mail:
info@rhhz.net 
| Variables | Description | All (N= |
P | ||
| Non-infection (n= |
Infection (n= |
||||
| Age [years, n (%)] | <0.000 1 | ||||
| <45 | |||||
| 45–49 | |||||
| 50–54 | |||||
| 55–59 | |||||
| 60–64 | |||||
| ≥65 | |||||
| Male [n (%)] | <0.000 1 | ||||
| White ethnicity or race [n (%)] | < |
||||
| TDI [median (quartile)] | −2.22 (−3.67, 0.35) | −1.66 (−3.39, 1.50) | −2.15 (−3.65, 0.53) | <0.000 1 | |
| BMI [kg/m2, n (%)] | < |
||||
| <18.5 | |||||
| 18.5≤BMI<25 | |||||
| 25≤BMI<30 | |||||
| ≥30 | |||||
| Income [£, n (%)] | < |
||||
| < |
|||||
| |
|||||
| |
|||||
| |
|||||
| > |
|||||
| Education [n (%)] | < |
||||
| Less than high school | |||||
| High school or equivalent | |||||
| College or above | |||||
| Employment [n (%)] | < |
||||
| Adequate exercise [n (%)] | < |
||||
| Smoking status [n (%)] | < |
||||
| Never | |||||
| Previous | |||||
| Current | |||||
| Drinking status [n (%)] | < |
||||
| Never | |||||
| Previous | |||||
| Current | |||||
| The categorical variables are presented as counts (percentage) and compared with the χ2 test between the two groups. The sum of the number of participants in all categories is not equal to the total number because of the missing data. Abbreviation: TDI, Townsend deprivation index. | |||||
DownLoad:
CSV
| Reported consumptions | Women (N= |
Men (N= |
Pheterogeneity by sex | |||||||
| No | no | OR (95% CI)a | P | No | no | OR (95% CI)a | P | |||
| Processed meat | ||||||||||
| Never | ||||||||||
| <1.0 time per week | ||||||||||
| 1.0 time per week | ||||||||||
| ≥2.0 times per week | < |
|||||||||
| Ptrend< |
Ptrend< |
|||||||||
| Poultry | ||||||||||
| Never | ||||||||||
| <1.0 time per week | ||||||||||
| 1.0 time per week | ||||||||||
| ≥2.0 times per week | ||||||||||
| Ptrend= |
Ptrend= |
|||||||||
| Red meat | ||||||||||
| <1.0 time per week | ||||||||||
| 1.0–1.9 times per week | ||||||||||
| 2.0–2.9 times per week | ||||||||||
| ≥3.0 times per week | < |
|||||||||
| Ptrend< |
Ptrend< |
|||||||||
| Red and processed meat | ||||||||||
| < 2.0 times per week | ||||||||||
| 2.0–2.9 times per week | ||||||||||
| 3.0–3.9 times per week | ||||||||||
| ≥4.0 times per week | < |
|||||||||
| Ptrend< |
Ptrend< |
|||||||||
| Fish | ||||||||||
| <1.0 time per week | ||||||||||
| 1.0–1.9 times per week | < |
< |
||||||||
| 2.0–2.9 times per week | < |
< |
||||||||
| ≥3.0 times per week | < |
< |
||||||||
| Ptrend= |
Ptrend= |
|||||||||
DownLoad:
CSV
| Reported consumptions | Women (N= |
Men (N= |
Pheterogeneity by sex | |||||||
| No | no | OR (95% CI)a | P | No | no | OR (95% CI)a | P | |||
| Cheese | ||||||||||
| <1.0 time per week | ||||||||||
| 1.0 time per week | ||||||||||
| 2.0–4.9 times per week | < |
|||||||||
| ≥5.0 times per week | < |
< |
||||||||
| Ptrend< |
Ptrend< |
|||||||||
| Fruit | ||||||||||
| <2.0 servings per day | ||||||||||
| 2.0–2.9 servings per day | < |
< |
||||||||
| 3.0–3.9 servings per day | < |
< |
||||||||
| ≥4.0 servings per day | < |
|||||||||
| Ptrend< |
Ptrend= |
|||||||||
| Vegetables | ||||||||||
| <2.0 servings per day | ||||||||||
| 2.0–2.9 servings per day | < |
< |
||||||||
| 3.0–3.9 servings per day | ||||||||||
| ≥4.0 servings per day | ||||||||||
| Ptrend= |
Ptrend= |
|||||||||
| Bread | ||||||||||
| ≤5 slices a week | ||||||||||
| 6–9 slices a week | ||||||||||
| 10–14 slices a week | ||||||||||
| ≥15 slices a week | ||||||||||
| Ptrend= |
Ptrend= |
|||||||||
| Cereal | ||||||||||
| ≤1 bowl a week | ||||||||||
| 2–4 bowls a week | ||||||||||
| 5–6 bowls a week | < |
< |
||||||||
| ≥7 bowls a week | < |
< |
||||||||
| Ptrend< |
Ptrend< |
|||||||||
DownLoad:
CSV
| Reported consumptions | Women (N= |
Men (N= |
Pheterogeneity by sex | |||||||
| No | no | OR (95% CI)a | P | No | no | OR (95% CI)a | P | |||
| Tea | ||||||||||
| <2.0 cups per day | ||||||||||
| 2.0–3.9 cups per day | < |
< |
||||||||
| 4.0–5.9 cups per day | < |
< |
||||||||
| ≥6.0 cups per day | ||||||||||
| Ptrend< |
Ptrend= |
|||||||||
| Water | ||||||||||
| <2 glasses per day | ||||||||||
| 2 glasses per day | ||||||||||
| 3–4 glasses per day | ||||||||||
| >4 glasses per day | < |
< |
||||||||
| Ptrend< |
Ptrend< |
|||||||||
| Alcohol | ||||||||||
| 0 cup per day | ||||||||||
| ≤1 cup per day | < |
< |
||||||||
| ≤2 cups per day | < |
< |
||||||||
| >2 cups per day | < |
< |
||||||||
| Ptrend< |
Ptrend= |
|||||||||
| aAdjusted for age, sex, ethnicity, assessment center, activity, Townsend deprivation index, and education. The unequal numbers of groups and each sex are because of the missing data. Abbreviations: No, number of participants; no, number of cases; CI, confidence interval; OR, odds ratio. | ||||||||||
DownLoad:
CSV
| Mediators | Exposure | Effect with mediator adjusted (OR with 95% CI)a |
Direct effect (OR with 95% CI)a |
Mediation proportion (%) (95% CI)a |
P |
| TG | Low meat-eaters vs. Ref. | 14.19 (10.43, 20.61) | <0.000 1 | ||
| Fish-eaters vs. Ref. | 7.92 (5.41, 12.68) | < |
|||
| Glucose | Low meat-eaters vs. Ref. | 7.27 (5.21, 10.99) | < |
||
| Fish-eaters vs. Ref. | 0.846 2 (0.791 3, 0.904 0) | 0.980 4 (0.973 7, 0.987 9) | 5.37 (3.63, 8.70) | <0.000 1 | |
| HbA1c | Low meat-eaters vs. Ref. | 0.948 9 (0.932 2, 0.965 9) | 0.993 5 (0.991 3, 0.995 7) | 17.26 (13.42, 24.18) | <0.000 1 |
| Fish-eaters vs. Ref. | 0.871 0 (0.817 1, 0.927 5) | 0.983 6 (0.977 2, 0.990 7) | 12.75 (9.21, 21.41) | <0.000 1 | |
| WBC | Low meat-eaters vs. Ref. | 0.954 5 (0.937 9, 0.971 4) | 0.994 2 (0.992 2, 0.996 4) | 24.14 (18.53, 34.1) | <0.000 1 |
| Fish-eaters vs. Ref. | 0.876 2 (0.822 5, 0.932 6) | 0.984 3 (0.977 5, 0.991 3) | 20.63 (14.37, 32.13) | <0.000 1 | |
| BMI | Low meat-eaters vs. Ref. | 0.972 5 (0.955 7, 0.989 6) | 0.996 5 (0.994 3, 0.998 7) | 53.59 (41.18, 75.45) | <0.000 1 |
| Fish-eaters vs. Ref. | 0.911 6 (0.856 1, 0.969 8) | 0.989 3 (0.982 8, 0.996 7) | 44.87 (33.01, 73.12) | <0.000 1 | |
| WHR | Low meat-eaters vs. Ref. | 0.970 3 (0.953 6, 0.987 3) | 0.996 3 (0.994 3, 0.998 4) | 50.41 (39.72, 70.67) | <0.000 1 |
| Fish-eaters vs. Ref. | 0.900 9 (0.846 3, 0.958 3) | 0.987 7 (0.980 1, 0.995 1) | 36.57 (25.73, 59.84) | <0.000 1 | |
| Body fat percentage | Low meat-eaters vs. Ref. | 0.968 1 (0.951 2, 0.985 2) | 0.996 0 (0.994 0, 0.998 1) | 49.26 (38.37, 67.43) | <0.000 1 |
| Fish-eaters vs. Ref. | 0.917 5 (0.861 3, 0.976 5) | 0.989 9 (0.982 4, 0.997 1) | 47.39 (33.09, 77.04) | <0.000 1 | |
| Whole body fat mass | Low meat-eaters vs. Ref. | 0.971 7 (0.954 8, 0.989 0) | 0.996 5 (0.994 3, 0.998 7) | 53.45 (41.84, 76.09) | <0.000 1 |
| Fish-eaters vs. Ref. | 0.919 1 (0.862 8, 0.978 3) | 0.990 0 (0.983 2, 0.997 5) | 46.87 (33.30, 77.84) | <0.000 1 | |
| Arms fat mass | Low meat-eaters vs. Ref. | 0.964 5 (0.948 0, 0.981 4) | 0.995 5 (0.993 3, 0.997 6) | 39.69 (30.44, 55.78) | <0.000 1 |
| Fish-eaters vs. Ref. | 0.893 2 (0.839 2, 0.949 9) | 0.986 6 (0.979 5, 0.993 8) | 31.54 (22.82, 51.12) | <0.000 1 | |
| Leg fat mass | Low meat-eaters vs. Ref. | 0.961 4 (0.944 9, 0.978 2) | 0.995 2 (0.993 1, 0.997 4) | 34.99 (26.95, 51.17) | <0.000 1 |
| Fish-eaters vs. Ref. | 0.887 9 (0.834 2, 0.944 2) | 0.986 1 (0.979 3, 0.993 4) | 28.44 (20.15, 47.18) | <0.000 1 | |
| Trunk fat mass | Low meat-eaters vs. Ref. | 0.969 1 (0.952 2, 0.986 3) | 0.996 1 (0.993 9, 0.998 2) | 49.49 (38.15, 68.13) | <0.000 1 |
| Fish-eaters vs. Ref. | 0.910 7 (0.855 0, 0.969 2) | 0.989 3 (0.982 3, 0.995 9) | 42.58 (30.17, 66.34) | <0.000 1 | |
| aAdjusted for age, sex, ethnicity, assessment center, activity, Townsend deprivation index, and education.Abbreviations: CI, confidence interval; OR, odds ratio; TG, total cholesterol; WBC, white blood cells; BMI, body mass index; WHR, waist-to-hip ratio. | |||||
DownLoad:
CSV