There is growing evidence that cellular metabolism can directly participate in epigenetic dynamics and consequently modulate gene expression. However, the role of metabolites in activating the key gene regulatory network for specialization of germ cell lineage remains largely unknown. Here, we identified some cellular metabolites with significant changes by untargeted metabolomics between mouse epiblast-like cells (EpiLCs) and primordial germ cell-like cells (PGCLCs). More importantly, we found that inhibition of glutaminolysis by bis-2- (5-phenylacetamido-1,3,4-thiadiazol-2-yl) ethyl sulfide (BPTES) impeded PGCLC specialization, but the impediment could be rescued by addition of α-ketoglutarate (αKG), the intermediate metabolite of oxidative phosphorylation and glutaminolysis. Moreover, adding αKG alone to the PGCLC medium accelerated the PGCLC specialization through promoting H3K27me3 demethylation. Thus, our study reveals the importance of metabolite αKG in the germ cell fate determination and highlights the essential role of cellular metabolism in shaping the cell identities through epigenetic events.
Germ cells provide a permanent link between generations and are the main driving force of genetic diversity in multicellular organisms. In the mammalian kingdom, the mouse is a widely used model for investigating the germ cell specialization and development. Mouse primordial germ cells (mPGCs), the origin of germ cells, are derived from proximal posterior epiblast cells in response to signals such as bone morphogenetic protein 4 (BMP4) and Wnt family member 3 at around embryonic day (E) 6.25. After specialization, a small cluster of alkaline phosphatases (AP)-positive mPGCs are established at the base of the incipient allantois at around E7.25[1]. Activation of germline determinants, as the first step in the early development of the mouse germ cells, is indispensable to mPGC specialization. For example, the transcription factor B-lymphocyte-induced maturation protein-1 (Blimp1, also known as Prdm1) has been demonstrated to be a prerequisite for establishment of the mouse germ cell lineage. Blimp1-deficient embryos failed to complete mPGC specification at E7.25[2]. Additionally, gene-knockout studies have evidenced that other germline determinants including PR domain containing 14 (Prdm14)[3], transcription factor AP-2γ (Tfap2c)[4], Brachyury (also known as T)[5], and the receptor tyrosine kinase-c-Kit[6] also play fundamental roles in mPGC specification. Mice carrying these gene mutations show impaired mPGC survival and growth. The established mPGCs individually migrate through the hindgut endoderm and mesentery and eventually colonize the embryonic gonads at around E10.5[1]. During the development of mouse germ cells, mPGCs undergo extensively epigenetic reprogramming including genome-wide DNA demethylation, histone modification changes and imprint erasure[7] (Supplementary Fig. 1A, available online).
To fully investigate the molecular mechanisms of mPGC specialization, a two-step in vitro PGCLC induction system has been established to recapitulate this developmental process in recent years[8]. Firstly, mouse embryonic stem cells (mESCs), cultured in 2i/Lif (two inhibitors of MEK and GSK3 signal pathways/leukemia inhibitory factor) condition, were induced into EpiLCs stimulated by activin A and basic fibroblast growth factor (bFGF). Day 2 EpiLCs resembled E5.75 in vivo pre-gastrulating epiblasts and were efficiently differentiated into PGCLCs in the presence of cytokines including BMP4, Lif, stem cell factor (SCF), and epidermal growth factor (EGF) (Supplementary Fig. 1B, available online). Day 2 induced cell aggregates showed strong expression of Blimp1 and Day 6 PGCLCs exhibited a highly similar transcriptome and epigenome to E9.5 mPGCs[9]. Moreover, it has been demonstrated that the PGCLCs have capabilities of gametogenesis and can generate fertile offsprings in vitro[10–11], indicating that the in vitro PGCLC induction system creates a reliable and robust platform to elucidate the underlying mechanisms of mPGC specialization.
Previous studies have employed the chromatin immunoprecipitation sequence to systematically delineate dynamic landscapes of histone modifications from mESCs to EpiLCs to PGCLCs[12]. The H3K27me3 modification was most abundant in mESCs, declined to a lower level in Day 2 EpiLCs and became almost undetectable in Day 2 PGCLCs, suggesting the different chromatin patterns during cellular differentiation. Demethylation of H3K27me3 is catalyzed by JumonjiC-domain (JmjC) containing histone lysine demethylases (KDMs), which are αKG/Fe2+-dependent dioxygenases[13]. Of note, the metabolite αKG is mainly produced from the mitochondrial tricarboxylic acid (TCA) cycle and glutamine catabolism, and always serves as the obligate cofactor to affect activities of chromatin-modifying enzymes: ten-eleven translocation hydroxylases (for DNA demethylation) and JmjC family demethylases (for histone demethylation)[13–14]. Evidence has been uncovered that the αKG-dependent chromatin modification is required for a variety of physiological processes such as T cell specialization[15], brown adipogenesis[16] and ESC differentiation[17]. For example, intracellular levels of αKG facilitates DNA demethylation at the promoter of PR domain containing 16 (Prdm16), which is essential for early brown adipogenesis[16]. Thus, the cellular metabolism plays a potential role in shaping the cellular identities through these epigenetic events.
Here we focused on the cellular metabolic signatures during PGCLC specification and confirmed dynamics of metabolites between EpiLCs and PGCLCs by mass spectrometry. Furthermore, we demonstrated that the metabolite αKG activates the expression of key germline determinants through regulating epigenetic reprogramming thereby promoting PGCLC specification.
Materials and methods
Chemicals
The bis-2-(5-phenylacetamido-1,3,4-thiadiazol-2-yl)ethyl sulfide (BPTES) and GSK J4 inhibitors were both purchased from Selleck, USA. Working solutions of BPTES and GSK J4 inhibitors were reconstituted and diluted in dimethyl sulfoxide (DMSO). Dimethyl-α-ketoglutarate (dm-αKG) was purchased from Sigma-Aldrich, USA. The concentrations of BPTES, dm-αKG and GSK J4 in this study were 1.5 μmol/L, 4 mmol/L and 2 μmol/L respectively, based on the previous literature[18–20].
mESC culture and PGCLC induction
All the cells were maintained in the cell incubator at 37 °C with 5% CO2. The mouse embryonic stem cell line bearing Venus-tagged Blimp1 reporter was a kind gift from Jiahao Sha's lab (Nanjing Medical University, China). mESC culture and PGCLC induction were performed as previously described[12]. Briefly, mESCs were cultured in N2B27 medium with 2i/Lif (PD0325901&CHIR9902: Selleck; Lif: Millipore, Germany). N2B27 medium consists of 50% DMEM/F12, 50% Neurobasal medium with 1×N2, 1×B27, 2 mmol/L Glutamax, 0.1 mmol/L NEAA, 1 mmol/L sodium pyruvate (Gibco, USA) and 0.1 mmol/L β-mercaptoethanol (Sigma-Aldrich). mESCs were maintained on a dish coated with 0.01% poly-L-ornithine solution (Sigma-Aldrich) and laminin (Invitrogen, USA) under a feeder-free condition.
To induce EpiLCs, approximately 2×10⁵ mESCs were dissociated into single cells by TrypLE Select Enzyme (Gibco) and plated on fibronectin (Santa Cruz, USA)-coated 3.5 cm dishes in N2B27 medium containing 20 ng/mL activin A (Peprotech, USA), 12 ng/mL bFGF (Peprotech) and 1% KnockOut serum replacement (KSR) (Gibco).
To induce PGCLCs, Day 2 EpiLCs were dissociated into single cells and seeded in wells of low-cell-binding U-bottom 96-well plates (2500 cells/well) (Corning, USA). The PGCLC medium contains GMEM supplemented with 15% KSR, 1 mmol/L sodium pyruvate, 0.1 mmol/L NEAA, 2 mmol/L L-glutamine (Gibco), 0.1 mmol/L β-mercaptoethanol, and 1% penicillin/streptomycin (Hyclone, USA) in the presence of BMP4 (500 ng/mL), Lif (1000 U/mL), SCF (100 ng/mL), and EGF (50 ng/mL) (Peprotech).
Cell treatment
To inhibit glutaminolysis, the experiment was performed as detailed below: during PGCLC induction, cells were incubated with PGCLC culture medium and 1.5 μmol/L BPTES (targeting glutaminase). The medium was changed every 24 hours and the cells were resupplemented with the indicated concentration of BPTES.
Untargeted metabolomics and data analysis
The untargeted metabolomics profiling was performed on XploreMET platform using gas chromatography-mass spectrometry (Metabo-Profile, China). The sample preparation procedures were followed as previously published[21]. The differential metabolites were obtained using univariate statistical analysis. Student's t-test. The P value together with log1.5 fold change (FC) is introduced with a cutoff value of 0.05 and 1.5 for P value and log1.5 FC, respectively.
Immunofluorescence staining
Cell aggregates were harvested and fixed for 15 minutes at room temperature in 4% paraformaldehyde in PBS (4% PFA) (Sigma-Aldrich). After fixation, samples were washed with PBS for 3 times (Sangon Biotech, China), 5 minutes per time, and then dehydrated through 10% and 20% sucrose each for 1 hour at 4 °C. Subsequently, samples were embedded in OCT (SAKURA, USA), and sectioned at 5 μm. Sections were permeabilized with 0.1% Triton X-100 in PBS (PBST) for 20 minutes and blocked for 1 hour with 1% bovine serum albumin (BSA) in PBS at room temperature (Sangon Biotech). Then, sections were incubated with the diluted primary antibody overnight at 4 °C. Next day, the sections were washed with PBST for 3 times, 5 minutes per time, and incubated with the diluted secondary fluorescence-conjugated antibody for 1 hour at room temperature in the dark. After being washed again, the sections were mounted with anti-fade mounting medium (Vectorlabs, USA). All images were obtained on ZEISS LSM700 confocal microscope (Carl Zeiss AG, Germany) and processed with Zeiss Zen Desk (Blue Edition). The antibodies mentioned are as follows: Rabbit polyclonal antibody-H3K27me3 (Millipore), Rabbit monoclonal antibody-Blimp1 (CST, USA), and Alexa Fluor 555 Donkey anti-Rabbit (IgG) secondary antibody (Thermo Fisher Scientific, USA).
Fluorescence activated cell sorting
For sample preparation, cell aggregates were harvested, washed with PBS and dissociated by TrypLE Select Enzyme for ~10 minutes at 37 °C. Dissociated cells were incubated in PE anti-c-Kit antibody/PBS (1:200) for 30 minutes in the dark at 37 °C (Biolegend, USA). Venus-tagged Blimp1 (Blimp1-Venus) positive PGCLCs can be detected with FITC channel on the BD FACSVerse (BD, USA). Data were analyzed with FlowJo software (Treestar, USA).
Quantitative reverse transcription PCR
Total RNAs from cell aggregates were isolated with TRIzol reagent according to the instructions (Invitrogen). Total RNA (500 ng) was reverse transcribed into cDNA using the RT reagent Kit (Takara, Japan). qPCR was performed in triplicate on ABI Q5 (Thermo Fisher Scientific) using ChamQ SYBR qPCR Master Mix for quantification of the target gene expression (Vazyme, China). Relative expression was normalized to Actb for each sample. The primers for quantitative reverse transcription PCR (qRT-PCR) amplification are summarized in Table 1.
Table
1.
Primers for quantitative reverse transcription PCR analysis
Glutamate dehydrogenase (GDH) activity assay was measured by using the GDH assay kit (Biovision, USA). Cells were seeded into 96-well plates and harvested 48 hours later. Cell aggregates were washed with cold PBS and then homogenized in 200 μL ice-cold Assay Buffer. After being centrifuged (13 000 g for 10 minutes), 50 μL supernatants were transferred into a new 96-well plate and added with 100 μL of reaction mix composed of 82 μL of GDH Assay Buffer, 8 μL of GDH Developer and 10 μL of glutamate for each well. The concentration of GDH was measured at a wavelength of 450 nm in a microplate reader (Biotek, USA) after incubation for 3 minutes at 37 °C (A0), and then measured again every 10 minutes (A1-An). We chose the period of linear range to calculate the GDH activity of the tested samples.
α-ketoglutarate colorimetric assay
αKG assay was measured by using the αKG assay kit (Biovision). Cells (2×10⁵) were rapidly homogenized with 100 µL of ice cold α-KG assay buffer and deproteinized using 10 kDa molecular weight cut off spin columns (Biovision). 50 µL samples were added into wells of a 96-well plate and 50 μL of reaction mix was added for each well. The samples were incubated for 30 minutes at 37 °C and measured OD at 570 nm in a microplate reader (Biotek). We chose the period of linear range to calculate the αKG concentrations of the tested samples.
Statistical analysis
All assays were performed for at least three times. Comparisons were made using unpaired two-tailed Student's t-tests and data were presented as mean±SD. In all cases, P values smaller than 0.05 were considered to be statistically significant. Statistical significance was set at *P<0.05,**P<0.01 and***P<0.001. Data were analyzed with GraphPad Prism8.0.
Results
Distinct metabolic signatures between EpiLCs and PGCLCs
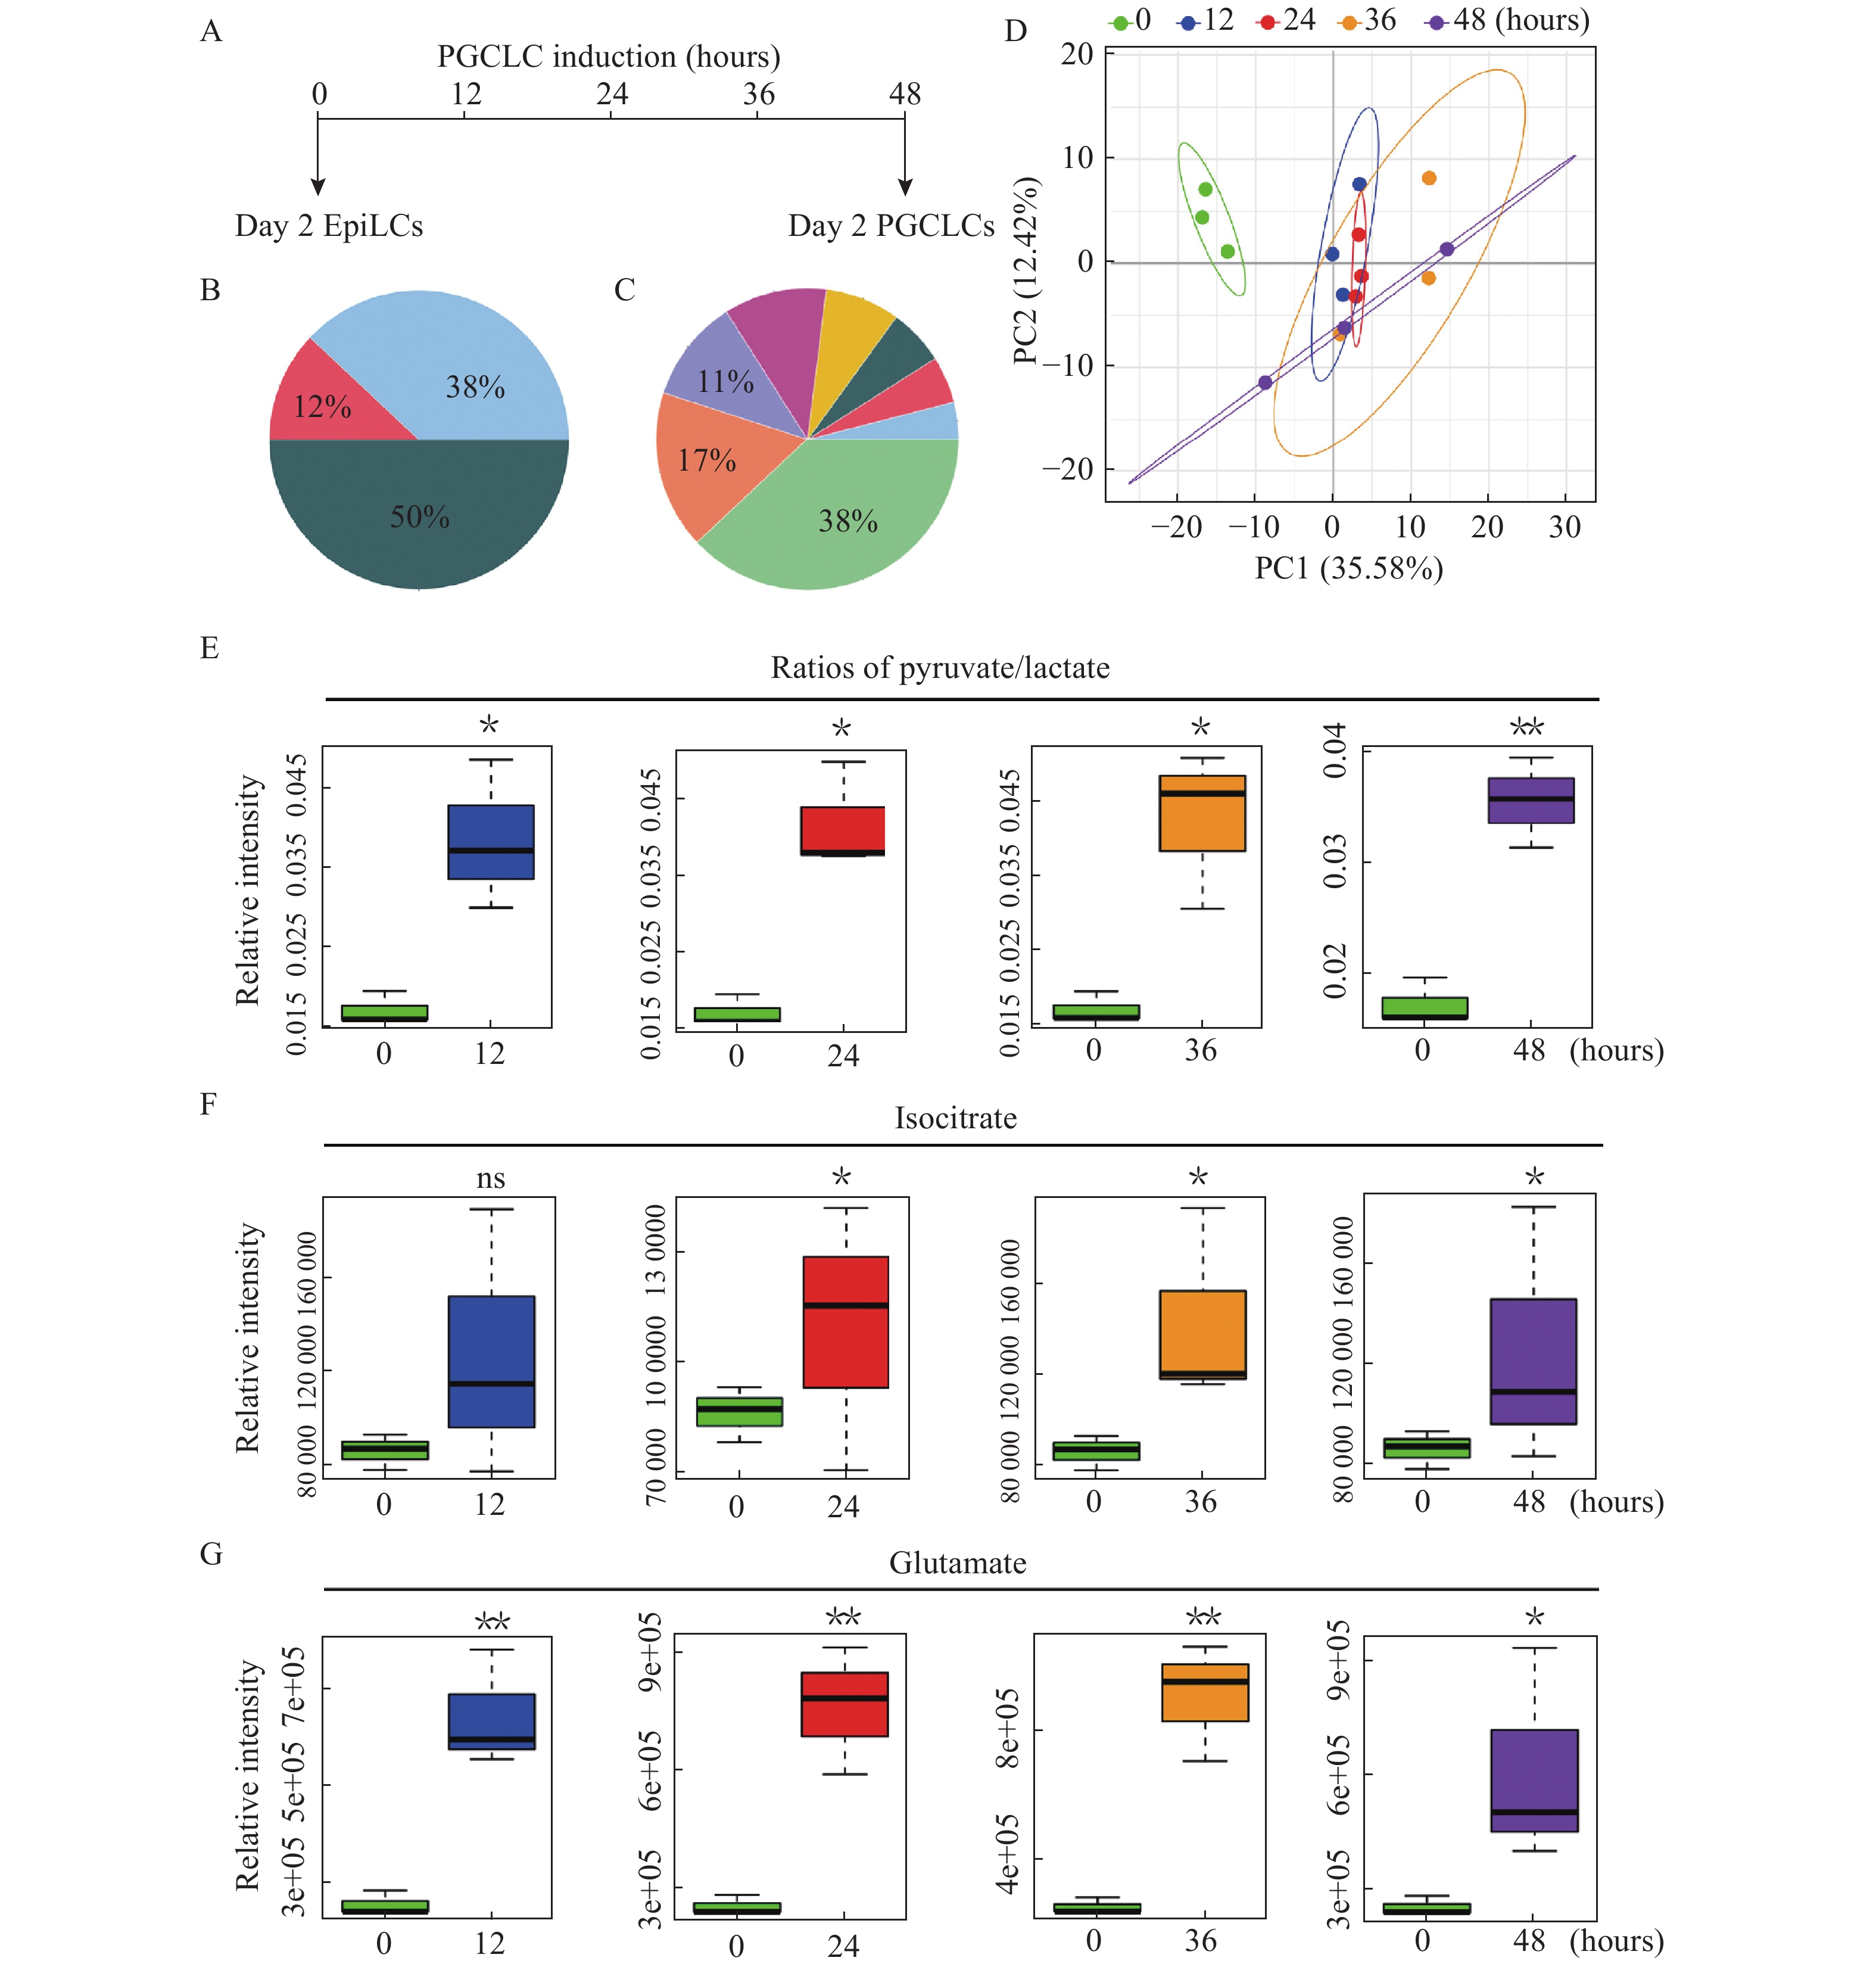
To explore the role of metabolites in the mPGC specialization, we used the in vitro PGCLC induction system to recapitulate the process of mPGC specialization in vivo. The untargeted metabolomics profiling was performed to assess global metabolites in induced cell aggregates at different time points from hour 0 (Day 2 EpiLCs) to hour 48 (Day 2 PGCLCs) (Fig. 1A). A total of 225 measurable and reproducible metabolite signals including 38% identified metabolites, 12% metabolic enzymes and 50% currently unidentified metabolites, were detected in the samples (Fig. 1B). The annotated metabolites and their chemical classes were illustrated in Fig. 1C. Most of metabolites can be categorized into amino acids (38%), organic acids (17%) and fatty acids (11%). The principal components analysis revealed that the global metabolic status of Day 2 EpiLCs was clearly distinct from that of other groups (Fig. 1D). We next examined the top 25 differential metabolites using univariate statistical analysis, most of which were significantly increased, such as glutamate, proline and threonine under PGCLC differentiation conditions (Supplementary Fig. 2, available online). The ratios of pyruvate/lactate and the TCA cycle intermediate metabolite-isocitrate showed an obvious elevation in induced PGCLC groups compared to those in Day 2 EpiLCs, which suggested an enhanced conversion of glucose to acetyl-coenzyme A (acetyl-CoA) and a higher mitochondria metabolism during the induction of PGCLCs (Fig. 1E and F). In addition to utilization of glucose, the glutamate content in induced cell aggregates increased remarkably compared with that in Day 2 EpiLCs (Fig. 1G and Supplementary Fig. 2, available online). Taken together, these results indicated that a distinct metabolic resetting exists in the course of PGCLC specialization.
Figure
1.
Untargeted metabolomics analysis of induced cell aggregates cultured in PGCLC medium.
A: A schematic diagram depicts the induction of PGCLCs. B: The pie chart illustrates a total of 225 measurable and reproducible metabolite signals including 38% identified metabolites (blue), 12% metabolic enzymes (light coralline) and 50% currently unidentified metabolites (green). C: The pie chart illustrates the annotated metabolites and their chemical classes including 38% amino acids (light green), 17% organic acids (light orange), 11% fatty acids (blue gray), 11% carbohydrates (orchid), 8% nucleotide (yellow), 5% alkylamines (light coralline), 4% lipids (blue), and 6% others (green). D: PCA analysis shows the global metabolic profiles from each subgroup. E–G: The boxplots show the representative differential metabolites obtained from univariate statistical analysis. Data are represented as mean±SD from three biological replicates. ns:not significant; EpiLCs: epiblast-like cells; PGCLCs: primordial germ cell-like cells; *P<0.05; **P<0.01.
Glutamine-αKG metabolic axis was important for PGCLC induction
Given the significant changes of metabolites during PGCLC induction, we wondered whether the considerable accumulation of glutamate is essential for the determination of germ cell fate. We used the mESC line expressing Venus reporter under the control of Blimp1 regulatory elements. Immunofluorescence (IF) staining validated the signals of Blimp1-Venus which were consistent with endogenous expression of Blimp1 in cell aggregates (Fig. 2A). Therefore, the detected signals of Venus fluorescence were used to represent the activation of Blimp1 in the subsequent experiments.
Figure
2.
Inhibition of glutamate catabolism blocked PGCLC specialization.
A: Immunostaining analysis of Blimp1 in induced cell aggregates at the indicated time points. Scale bar: 10 μm. B: A schematic diagram depicts the major catabolic pathways of glucose and glutamine. C: Activity assay of GDH in the 48-hour cell aggregates cultured in the presence or absence of BMP4. Data are represented as mean±SD from three biological replicates. D: Representative bright field and fluorescence images of 48-hour cell aggregates cultured in the indicated medium. Scale bars: 200 μm. E: Fluorescence activated cell sorting analysis of the percentages of Venus-tagged Blimp1 (Blimp1-Venus) and PE anti-c-Kit positive cells in 48-hour cell aggregates cultured in the indicated medium. **P<0.01.
Glutamine is an important energy source, which can be converted to glutamate by glutaminase and further oxidized to αKG to fuel the TCA cycle by GDH[22] (Fig. 2B). The enzymatic activity and mRNA expression level of Glud1 were up-regulated in 48-hour cell aggregates cultured with full cytokines (BMP4, SCF, EGF and Lif), compared with those in the group cultured without BMP4 (Fig. 2C and Supplementary Fig. 3A, available online). We further confirmed the intracellular αKG levels and found an increase of αKG in the cell aggregates in response to the signals of PGCLC differentiation (Supplementary Fig. 3B, available online). As shown in Fig. 2B, BPTES can selectively inhibit glutaminase activity, thus lowering the levels of glutamate and other downstream metabolic intermediates[23]. We attempted to add 1.5 μmol/L BPTES in the culture medium to block glutamine-glutamate conversion during PGCLC induction. After analyzing the fluorescence intensities of Venus in 48-hour cell aggregates, we found that the Blimp1 expression decreased obviously in the BPTES-treated group compared with that in the controls, indicating the PGCLC formation was severely inhibited by blocking the glutamine catabolism (Fig. 2D). Considering that the metabolite αKG is the downstream product of glutamate, we asked whether supplementation of αKG in the BPTES-treated group could rescue the expression of Blimp1. The cell-permeable dm-αKG was added in the BPTES-treated group to supplement the content of intracellular αKG during PGCLC induction. Interestingly, the intensities of Venus were restored in 48-hour cell aggregates (Fig. 2D). Furthermore, we analyzed the efficiencies of PGCLC specialization in 48-hour cell aggregates by fluorescence activated cell sorting (FACS). The percentages of Blimp1-Venus positive cells decreased from ~36.9% to 12.9% and Blimp1-Venus/PE anti-c-Kit double positive cells decreased from ~4.73% to 0.306% after the cell aggregates were treated with 1.5 μmol/L BPTES. With supplementation of 4 mmol/L dm-αKG in the BPTES-treated group, the percentages of Blimp1-Venus positive cells recovered to a comparable level to that of the control group in 48-hour cell aggregates (Fig. 2E and Supplementary Fig. 3C, available online). Collectively, these data revealed that the glutamine-αKG metabolic axis plays an important role in PGCLC specification.
αKG accelerated the specification of PGCLCs
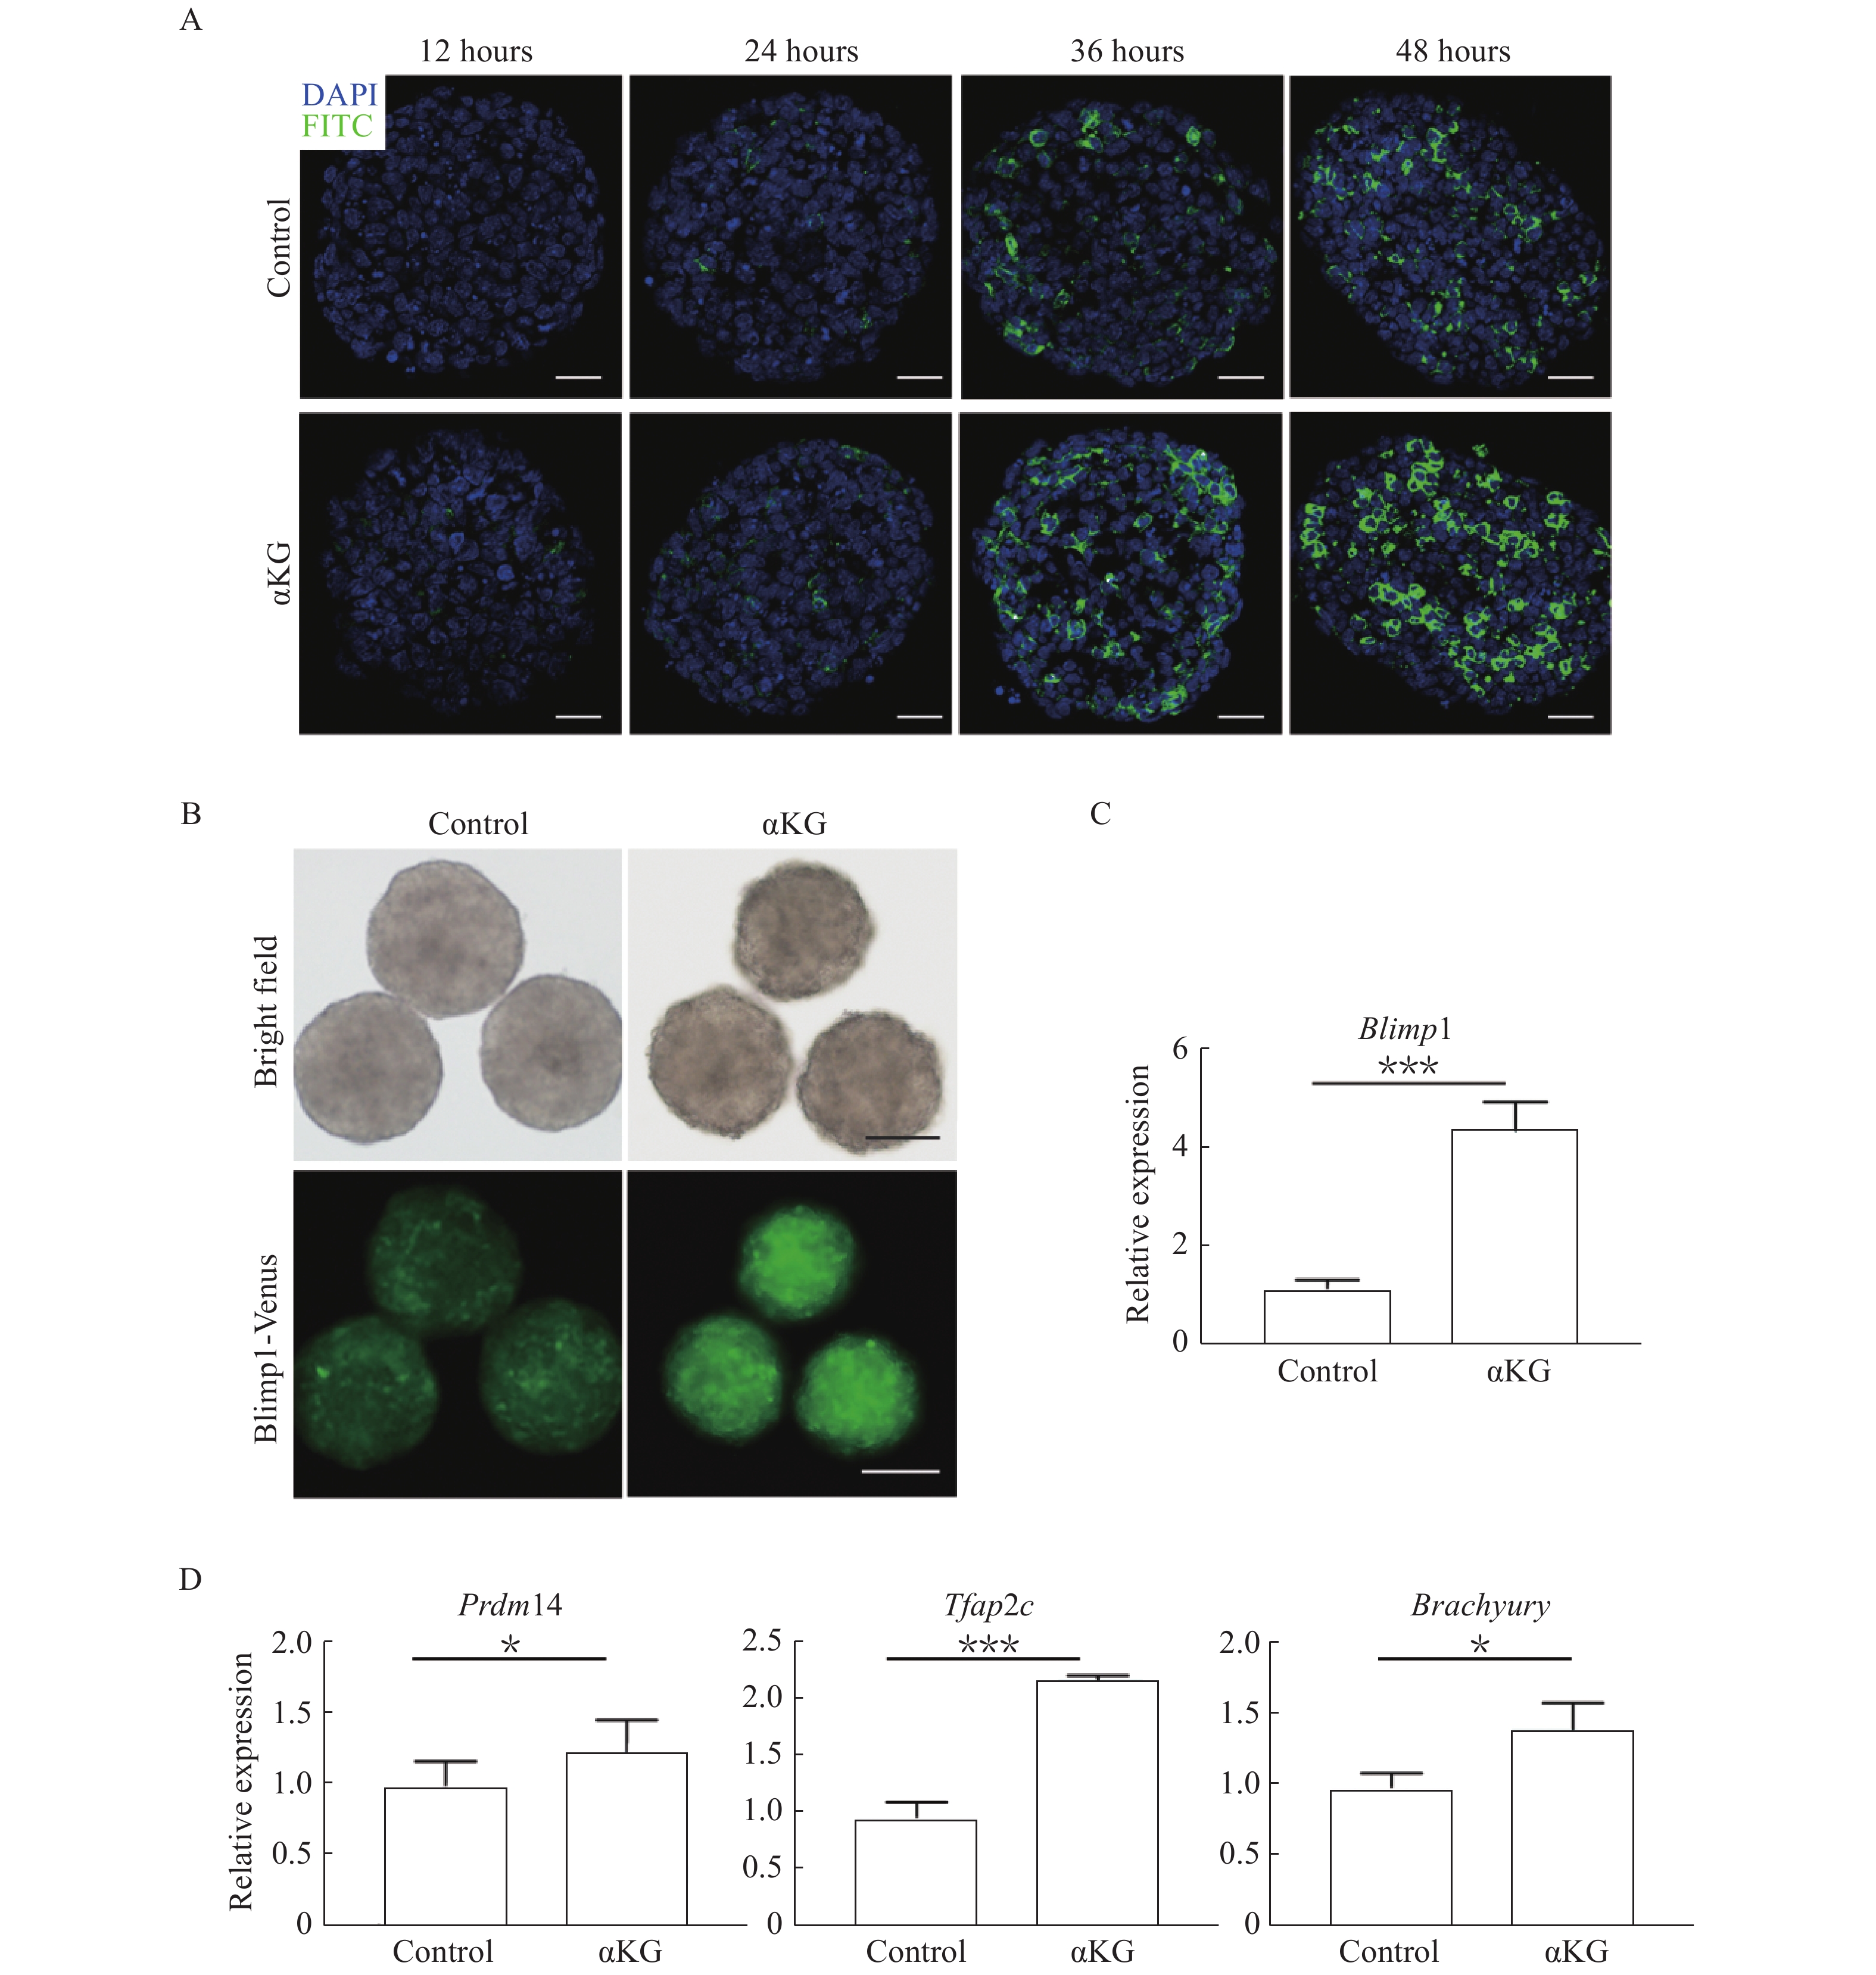
Owing to the role of dm-αKG in BPTES-treated PGCLCs, it is tempting to ask whether addition of dm-αKG alone can promote PGCLC specification. To test our hypothesis, we examined the Blimp1-Venus expression of cell aggregates cultured in the presence or absence of 4 mmol/L dm-αKG by IF staining during the different time points of induction. As observed in Fig. 3A, the ratios of Blimp1-Venus positive cells in dm-αKG treated group were relatively higher than those in the control group at the indicated same time point when the signals of Blimp1-Venus could be detected. Consistently, the fluorescence intensities of Venus in 48-hour cell aggregates treated with dm-αKG were significantly stronger than those in the control group, implying that dm-αKG plays a positive role in PGCLC specification (Fig. 3B). Consistently qRT-PCR analysis showed the mRNA expression level of Blimp1 was up-regulated in the dm-αKG treated 48-hour cell aggregates compared with that in the controls (Fig. 3C). In addition, the mRNA expression levels of other important germline determinants such as Tfap2c, Prdm14 and Brachyury (T) were increased in response to dm-αKG treatment as well (Fig. 3D), demonstrating that dm-αKG can activate germline determinants and promote the specification of PGCLCs.
Figure
3.
αKG promoted PGCLC specialization.
A: Immunostaining analysis of Venus-tagged Blimp1 (Blimp1-Venus) in the controls and 4mM dm-αKG treated induced cell aggregates at the indicated time points. Scale bar: 50 μm. B: Representative bright field and fluorescence images of 48-hour cell aggregates cultured in the PGCLC medium with or without 4 mmol/L dm-αKG. Scale bars: 200 μm. C and D: Quantitative reverse transcription PCR analysis shows the mRNA level of Blimp1, Prdm14, Tfap2c and Brachyury in the 48-hour cell aggregates cultured in the PGCLC medium with or without 4 mmol/L dm-αKG. The relative expression is normalized to Actb and represented as mean±SD from three biological replicates. *P<0.05, ***P<0.001.
αKG facilitated the demethylation of H3K27me3 during PGCLC specification
Considering αKG is a cofactor of KDMs, we wondered whether dm-αKG plays a role in germ cell fate determination through regulation of epigenetic events. JMJD3 and UTX are two well-known members of KDMs and specific for the H3K27me3 demethylation[24]. Firstly, we added 2 μmol/L GSK J4 in the normal PGCLC medium, which was proven to be an effective inhibitor of JMJD3 and UTX[25]. The fluorescence intensities of Blimp1-Venus decreased significantly in the GSK J4 treated 48-hour cell aggregates compared with those in the controls, indicating that H3K27me3 demethylation is crucial for the normal PGCLC specialization. Notably, when GSK J4 was added in dm-αKG treated group, the fluorescence intensities of Blimp1-Venus weakened to a barely detectable level compared with those of controls, suggesting that GSK J4 counteracted the effect of dm-αKG in accelerating PGCLC specialization (Fig. 4A). We next performed the FACS analysis in 48-hour cell aggregates. The percentages of Blimp1-Venus positive cells and Blimp1-Venus/PE anti-c-Kit double positive cells dropped by ~25% and ~1.3% respectively, after the cell aggregates were treated with GSK J4. Furthermore, the percentages of Blimp1-Venus positive cells and Blimp1-Venus/PE anti-c-Kit double positive cells dropped by ~37% and ~1.9% respectively, after the cell aggregates were treated with GSK J4 and dm-αKG simultaneously (Fig. 4B and Supplementary Fig. 4, available online).
Figure
4.
H3K27me3 demethylation was essential for PGCLC specialization.
A: Representative bright field and fluorescence images of 48-hour cell aggregates cultured in the indicated PGCLC medium. Scale bars: 200 μm. B: Fluorescence activated cell sorting analysis of the percentages of Venus-tagged Blimp1 (Blimp1-Venus) and PE anti-c-Kit positive cells in 48-hour cell aggregates cultured in the indicated PGCLC medium. C: Immunofluorescence of Blimp1-Venus and H3K27me3 in 24-hour cell aggregates cultured in the indicated culture medium. Scale bar: 50 μm.
On the other hand, to confirm the early epigenetic changes affected by dm-αKG, we examined H3K27me3 levels in 24-hour cell aggregates under the above-mentioned conditions. IF staining showed that addition of GSK J4 alone in the PGCLC medium increased total nuclear H3K27me3 levels, whereas addition of dm-αKG alone distinctly reduced total nuclear H3K27me3 levels and activated the Blimp1-Venus expression. However, the simultaneous treatment of GSK J4 and dm-αKG caused strong nuclear H3K27me3 signals and diminished Blimp1-Venus expression in 24-hour cell aggregates (Fig. 4C). Therefore, we speculated that epigenetic reprogramming is required for the process of PGCLC specification and dm-αKG promotes the specialization of PGCLCs by ensuring H3K27me3 sufficient demethylation.
Discussion
In this study, we found that specialization of PGCLCs was accompanied by metabolic transitions and the availability of some metabolites involving aerobic oxidation and glutaminolysis changed during PGCLC specialization. Inhibiting glutaminolysis with BPTES severely hindered PGCLC specialization, but the phenotype could be rescued by supplementation of the downstream metabolite αKG. Furthermore, addition of dm-αKG alone promoted the PGCLC formation through enhancing H3K27me3 demethylation. These findings supported that metabolic reprogramming plays an important role in the germ cell fate decisions. Nevertheless, dm-αKG could not fully rescue the percentages of Blimp1-Venus/PE anti-c-Kit double positive cells in the BPTES-treated group (Fig. 2E). We hypothesized that other downstream intermediate metabolites of glutamine potentially contribute to the specialization of PGCLCs as well.
As an important TCA cycle intermediate, dm-αKG may aggravate cellular oxidative stress in the PGCLC induced system, which in turn promotes production of reactive oxygen species (ROS)[26]. ROS are natural byproducts of aerobic metabolism and known regulators in various physiological and pathological processes. Excessive accumulation of intracellular ROS is detrimental to cell growth and exerts cytotoxic effects[27–28]. On the other hand, ROS generated from oxidative stress have been shown to regulate epigenetic events such as DNA methylation and histone acetylation. ROS can silence gene expression of tumor suppressors by enhancing DNA methylation under oxidative stress conditions[29]. Thus, it is worth noting that other epigenetic modifications affected by oxidative stress also orchestrate the determination of germ cell fates, which need us to further clarify.
Cellular metabolism involves a series of biological reactions that provide nutriments and energy for maintaining the living state of cells. For a long time, cellular metabolism was thought to be the consequences of cellular identities, just providing the basic housekeeping functions in living organisms. In recent years, researchers have realized that cellular metabolism can serve as an active participant in many processes such as tumorigenesis and cellular differentiation through regulating epigenetic reprogramming[30–34]. For example, the metabolite S-adenosylmethionine (SAM) is the methyl donor for the DNA methylation[33], and that acetyl-CoA is the donor for histone acetyltransferases[34]. The activities of chromatin-modifying enzymes largely depend on the availability of specific metabolites. It has been reported that phosphoserine aminotransferase 1 (Psat1), a glycolysis-branched transaminase, regulates intracellular αKG levels in mESCs[35]. Knockdown of Psat1 lowers the amounts of intracellular αKG and accelerates the timing of mESC differentiation. In contrast, the addition of dm-αKG in the culture medium reinforces mESC pluripotency. Mechanistically, nuclear epigenetic dynamics such as 5′-hydroxymethylcytosine (5′-hmC), H3K9me3, H3K36me3 and H3K27me3 can be adjusted to the fluctuation of intracellular αKG levels, which ultimately influence the transcriptional networks in mESCs. However, it is still unclear how the cell can sense subtle fluctuations of metabolites to regulate epigenetic events and spatiotemporally affect the expression of key genes required for cellular identities.
In conclusion, we used the PGCLC induction system to exploit the role of cellular metabolism in germ cell fate determination. Our experiments demonstrated that glutamine-αKG metabolic axis is essential for PGCLC induction and the metabolite αKG can promote PGCLC specialization through regulating H3K27me3 demethylation. Our findings provide a new insight into the highly collaborative program among cellular metabolism, epigenetic dynamics and cellular differentiation.
Acknowledgments
This work was supported by grants from the National Natural Science Foundation of China (No. 31871445 and No. 31501211) and the National Key R&D program of China (No. 2017YFC1001302 and No. 2016YFA0503300).
Saitou M, Yamaji M. Primordial germ cells in mice[J]. Cold Spring Harb Perspect Biol,2012, 4(11): a008375.
[2]
Ohinata Y, Payer B, O'Carroll D, et al. Blimp1 is a critical determinant of the germ cell lineage in mice[J]. Nature,2005, 436(7048): 207–213. doi: 10.1038/nature03813
[3]
Yamaji M, Seki Y, Kurimoto K, et al. Critical function of Prdm14 for the establishment of the germ cell lineage in mice[J]. Nat Genet,2008, 40(8): 1016–1022. doi: 10.1038/ng.186
[4]
Schäfer S, Anschlag J, Nettersheim D, et al. The role of BLIMP1 and its putative downstream target TFAP2C in germ cell development and germ cell tumours[J]. Int J Androl,2011, 34(4pt2): e152–e159. doi: 10.1111/j.1365-2605.2011.01167.x
[5]
Aramaki S, Hayashi K, Kurimoto K, et al. A Mesodermal Factor, T, Specifies mouse germ cell fate by directly activating germline determinants[J]. Dev Cell,2013, 27(5): 516–529. doi: 10.1016/j.devcel.2013.11.001
[6]
De Miguel MP, Cheng LZ, Holland EC, et al. Dissection of the c-Kit signaling pathway in mouse primordial germ cells by retroviral-mediated gene transfer[J].Proc Natl Acad Sci USA,2002, 99(16): 10458–10463. doi: 10.1073/pnas.122249399
[7]
Saitou M, Kagiwada S, Kurimoto K. Epigenetic reprogramming in mouse pre-implantation development and primordial germ cells[J]. Development,2012, 139(1): 15–31. doi: 10.1242/dev.050849
[8]
Hayashi K, Ohta H, Kurimoto K, et al. Reconstitution of the Mouse Germ Cell specification pathway in culture by pluripotent stem cells[J]. Cell,2011, 146(4): 519–532. doi: 10.1016/j.cell.2011.06.052
[9]
Hayashi K, Saitou M. Generation of eggs from mouse embryonic stem cells and induced pluripotent stem cells[J]. Nat Protoc,2013, 8(8): 1513–1524. doi: 10.1038/nprot.2013.090
[10]
Saitou M, Miyauchi H. Gametogenesis from pluripotent stem cells[J]. Cell Stem Cell,2016, 18(6): 721–735. doi: 10.1016/j.stem.2016.05.001
[11]
Zhou Q, Wang M, Yuan Y, et al. Complete meiosis from embryonic stem cell-derived germ cells in vitro[J]. Cell Stem Cell,2016, 18(3): 330–340. doi: 10.1016/j.stem.2016.01.017
[12]
Kurimoto K, Yabuta Y, Hayashi K, et al. Quantitative dynamics of chromatin remodeling during germ cell specification from mouse embryonic stem cells[J]. Cell Stem Cell,2015, 16(5): 517–532. doi: 10.1016/j.stem.2015.03.002
[13]
Sharma U, Rando OJ. Metabolic inputs into the epigenome[J]. Cell Metab,2017, 25(3): 544–558. doi: 10.1016/j.cmet.2017.02.003
[14]
Altman BJ, Stine ZE, Dang CV. From Krebs to clinic: glutamine metabolism to cancer therapy[J]. Nat Rev Cancer,2016, 16(10): 619–634. doi: 10.1038/nrc.2016.71
[15]
Klysz D, Tai XG, Robert PA, et al. Glutamine-dependent α-ketoglutarate production regulates the balance between T helper 1 cell and regulatory T cell generation[J]. Sci Signal,2015, 8(396): ra97. doi: 10.1126/scisignal.aab2610
[16]
Yang QY, Liang XW, Sun XF, et al. AMPK/α-Ketoglutarate axis dynamically mediates DNA Demethylation in the Prdm16 promoter and brown Adipogenesis[J]. Cell Metab,2016, 24(4): 542–554. doi: 10.1016/j.cmet.2016.08.010
[17]
Carey BW, Finley LWS, Cross JR, et al. Intracellular α-ketoglutarate maintains the pluripotency of embryonic stem cells[J]. Nature,2015, 518(7539): 413–416. doi: 10.1038/nature13981
[18]
Park S, Safi R, Liu XJ, et al. Inhibition of ERRα prevents mitochondrial pyruvate uptake exposing NADPH-generating pathways as targetable vulnerabilities in breast cancer[J]. Cell Rep,2019, 27(12): 3587–3601. doi: 10.1016/j.celrep.2019.05.066
[19]
TeSlaa T, Chaikovsky AC, Lipchina I, et al. α-Ketoglutarate accelerates the initial differentiation of primed human pluripotent stem cells[J]. Cell Metab,2016, 24(3): 485–493. doi: 10.1016/j.cmet.2016.07.002
[20]
Hofstetter C, Kampka JM, Huppertz S, et al. Inhibition of KDM6 activity during murine ESC differentiation induces DNA Damage[J]. J Cell Sci,2016, 129(4): 788–803. doi: 10.1242/jcs.175174
[21]
Qiu YP, Cai GX, SU MM, et al. Serum metabolite profiling of human colorectal cancer using GC-TOFMS and UPLC-QTOFMS[J]. J Proteome Res,2009, 8(10): 4844–4850. doi: 10.1021/pr9004162
[22]
Zielke HR, Zielke CL, Ozand PT. Glutamine: a major energy source for cultured mammalian cells[J]. Fed Proc,1984, 43(1): 121–125.
[23]
Song M, Kim SH, Im CY, et al. Recent development of small molecule glutaminase inhibitors[J]. Curr Top Med Chem,2018, 18(6): 432–443. doi: 10.2174/1568026618666180525100830
[24]
Agger K, Cloos PAC, Christensen J, et al. UTX and JMJD3 are histone H3K27 demethylases involved in HOX gene regulation and development[J]. Nature,2007, 449(7163): 731–734. doi: 10.1038/nature06145
[25]
Yan NN, Xu L, Wu XB, et al. GSKJ4, an H3K27me3 demethylase inhibitor, effectively suppresses the breast cancer stem cells[J]. Exp Cell Res,2017, 359(2): 405–414. doi: 10.1016/j.yexcr.2017.08.024
[26]
Zorov DB, Juhaszova M, Sollott SJ. Mitochondrial Reactive Oxygen Species (ROS) and ROS-induced ROS release[J]. Physiol Rev,2014, 94(3): 909–950. doi: 10.1152/physrev.00026.2013
[27]
Zha ZM, Wang JH, Li SL, et al. Pitavastatin attenuates AGEs-induced mitophagy via inhibition of ROS generation in the mitochondria of cardiomyocytes[J]. J Biomed Res,2018, 32(4): 281–287.
[28]
Guo Z, Zhou BR, Li W, et al. Hydrogen-rich saline protects against ultraviolet B radiation injury in rats[J]. J Biomed Res,2012, 26(5): 365–371. doi: 10.7555/JBR.26.20110037
[29]
Zhang R, Kang KA, Kim KC, et al. Oxidative stress causes epigenetic alteration of CDX1 expression in colorectal cancer cells[J]. Gene,2013, 524(2): 214–219. doi: 10.1016/j.gene.2013.04.024
[30]
Periyasamy K, Sivabalan V, Baskaran K, et al. Cellular metabolic energy modulation by tangeretin in 7,12-dimethylbenz(a) anthracene-induced breast cancer[J]. J Biomed Res,2016, 30(2): 134–141.
[31]
Etchegaray JP, Mostoslavsky R. Interplay between metabolism and epigenetics: A nuclear adaptation to environmental changes[J]. Mol Cell,2016, 62(5): 695–711. doi: 10.1016/j.molcel.2016.05.029
[32]
Chisolm DA, Weinmann AS. Connections between metabolism and epigenetics in programming cellular differentiation[J]. Annu Rev Immunol,2018, 36: 221–246. doi: 10.1146/annurev-immunol-042617-053127
[33]
Mentch SJ, Locasale JW. One-carbon metabolism and epigenetics: understanding the specificity[J]. Ann N Y Acad Sci,2016, 1363(1): 91–98. doi: 10.1111/nyas.12956
[34]
Sivanand S, Viney I, Wellen KE. Spatiotemporal control of acetyl-CoA metabolism in chromatin regulation[J]. Trends Biochem Sci,2018, 43(1): 61–74. doi: 10.1016/j.tibs.2017.11.004
[35]
Hwang IY, Kwak S, Lee S, et al. Psat1-dependent fluctuations in α-ketoglutarate affect the timing of ESC differentiation[J]. Cell Metab,2016, 24(3): 494–501. doi: 10.1016/j.cmet.2016.06.014
Doroftei B, Ilie OD, Timofeiov S, et al. A scoping review regarding reproductive capacity modulation based on alpha-ketoglutarate supplementation. Reproduction, 2024, 168(5): e240137.
DOI:10.1530/REP-24-0137. Print 2024 Nov 1
2.
Liu Y, Cui DX, Pan Y, et al. Metabolic-epigenetic nexus in regulation of stem cell fate. World J Stem Cells, 2022, 14(7): 490-502.
DOI:10.4252/wjsc.v14.i7.490
3.
Xie Y, Wu C, Li Z, et al. Early Gonadal Development and Sex Determination in Mammal. Int J Mol Sci, 2022, 23(14): 7500.
DOI:10.3390/ijms23147500
4.
Hayashi Y, Matsui Y. Metabolic Control of Germline Formation and Differentiation in Mammals. Sex Dev, 2022, 16(5-6): 388-403.
DOI:10.1159/000520662
5.
Matsui Y, Hayashi Y. Metabolic pathways regulating the development and non-genomic heritable traits of germ cells. J Reprod Dev, 2022, 68(2): 96-103.
DOI:10.1262/jrd.2021-137
 Authors and Reviewers

 DownLoad: