Authors and Reviewers
Figure
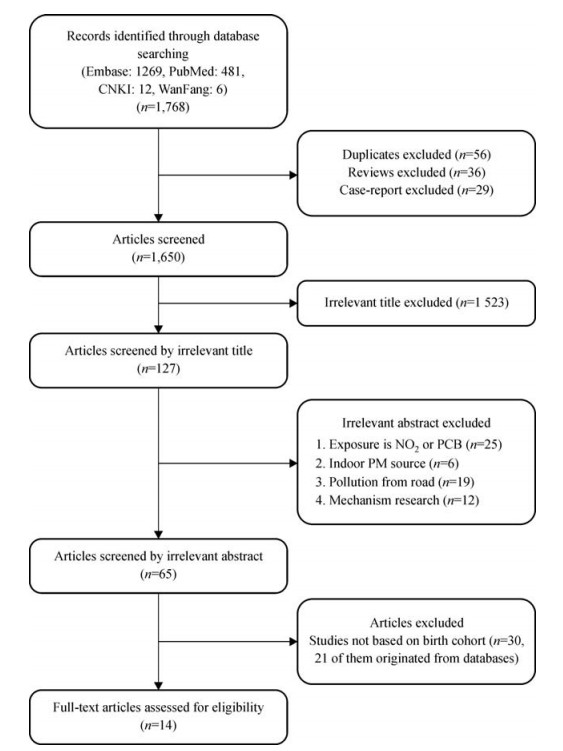
1.
Flow chart of selection of studies
4.6
2.2
| Citation: |
Ji Yinwen, Song Fei, Xu Bo, Zhu Yining, Lu Chuncheng, Xia Yankai. Association between exposure to particulate matter during pregnancy and birthweight: a systematic review and a metaanalysis of birth cohort studies[J]. The Journal of Biomedical Research, 2019, 33(1): 56-68. DOI: 10.7555/JBR.31.20170038

|
Ambient particulate matter (PM) pollution contains PM10 (aerodynamic diameter < 10 mm) and PM2.5 (aerodynamic diameter < 2.5 mm), has been greatly associated with some negative health outcomes, including morbidity and mortality of cardiovascular[1-2] or respiratory diseases[3-4]. In recent 20 years, the relationship between ambient PM and birth outcome has been the subject of much epidemiological research[5-10].
Birthweight is a characteristic indicator of prenatal growth, and infants with low birthweight (LBW) is one of the adverse pregnancy outcomes. Infants with LBW are at a greater risk of mortality and morbidity than infants with normal birthweight, as well as having health issues in childhood and beyond. These effects include asthma, hypertension and compromised cognitive ability[11-13]. Accordingly, exploring the risk factors for LBW, in order to reduce the occurrence of LBW, is extremely important to public health. The connection between heavy air pollutants, exposure during pregnancy, and LBW in recent years are investigated by numerous studies. Laurent et al. found that LBW was positively and significantly associated with the zone but not total fine PM[14]. Similarly, a national study conducted in Canada discovered that there was a steady indication of a dose-response association for NO2 but no PM2.5 impact on LBW[15]. Also, daily PM2.5 with individual gestational ages of births in the contiguous United States was linked by another national study. This study indicated no overall significant positive connection between LBW and PM2.5 exposure during pregnancy[16].
A number of researches explored significant relationships between PM exposure and LBW[17-18]. These inconsistent and controversial results suggest that quantitatively integration and interpretation of available evidence produce more accurate results for policy decisions and clinical need is necessary.
Results from several independent studies can be quantitatively integrated using meta-analysis, a most commonly used statistical method[19]. The relationship between PM exposure of pregnant women and neonatus birthweight has also been quantitatively analyzed by a number of meta-analyses[6, 20-21]. However, all these meta-analyses observed notable heterogeneity among the studies included. Therefore, integrating various study results was necessary through a meta-analysis.
Here, we collected several studies that evaluated the effects of PM (PM2.5 and PM10) exposure during pregnancy on LBW, followed by employing a model of meta-analysis to estimate the effects of PM exposure on LBW during various pregnancy phases based upon birth cohort studies. The study site, sample, publish year, and exposure measurement methods were further evaluated for their potential influence on our meta-analysis.
Birth cohort studies provide the strongest evidence to comprehend the incidence and progression of diseases made possible by frequent follow-up data. None of the systematic reviews to date have paid special attention to the evidence from birth cohorts. Therefore, we present a systematic review and meta-analysis to estimate the effects of PM exposure during the different gestational periods with LBW.
We perform and report the corresponding results in this meta-analysis based on the Preferred Reporting Items for Systematic Reviews and Meta-analyses (PRISMA) guidelines[22].
All publications indexed in English-language databases including PubMed, Google Scholar, and Embase; as well as Chinese-language databases such as China National Knowledge Infrastructure (CNKI), WanFang databases before March 6, 2017, were systematically searched for studies which can be included into our meta-analysis. A combination of the following keywords were used for searching the relevant literatures: ("air pollution" OR "particulate matter" OR "fine particulate matter" OR "fine particles" OR "PM" OR "PM10" OR "PM2.5") AND ("cohort" OR "observational" OR "longitudinal" OR "follow-up") AND ("birth weight" OR "BW" OR "change in birth weight" OR "low birth weight" OR "LBW" OR "term low birth weight" OR "TLBW" OR "adverse birth outcomes" OR "adverse pregnancy outcomes"). Simultaneously, the references of relevant publications and meta-analysis were also investigated manually.
Eligible studies included were considered if they satisfied the following conditions: (1) using cohort study design (e.g., not descriptive study, case-control design and experimental design, randomized controlled trial, etc.); (2) LBW was defined as a live birth weighing less than 2500 g, including term LBW (TLBW) and preterm LBW (PLBW); (3) sample size, partial regression coefficient (β) for birthweight, usable risk estimates (e.g., odds ratio (OR), risk ratio (or relative risk, RR) or necessary data for calculation) for LBW, and its 95% confidence intervals (CI), or necessary information from which these results could be inferred; (4) other risk factors that could impact the outcomes of pregnancy had to be modified, including but not limited to maternal age and infant sex. If a birth season, maternal tobacco, or alcohol consumption during pregnancy and socioeconomic status were also modified; (5) only publications in English or Chinese were considered.
In the last step, we excluded the birth records directly from the database or national public health system, and sources of PM pollution from indoor were also ignored.
Independently, JY and SF conducted a quality assessment of each study, included in our study, referring to the criteria derived from the NewcastleOttawa Scale (NOS)[23]. The NOS, which is used for assessing the quality of nonrandomized studies in metaanalyses, is available at: http://www.ohri.ca/programs/clinical_epidemiology/oxford.asp. All literature included in this study were cohort studies. The items of NOS score for cohort studies was divided into three domains: selection of cohort (four points), comparability of the cohort (two points), and assessment of outcome (three points). The quality of the study was considered high or moderate if the sum score was eight points or greater or between five and seven points, respectively. This ensured that each of the eligible articles was of high or moderate quality.
Data was extracted from all eligible studies by two independent researchers (JY and SF) based on a standardized form. We resolved discrepancies by discussing with a third researcher (XB) extracting information consisting of the first author's name, year of publication, study location, study name, sample size, pollutant, exposure assessment, PM exposure windows (if a research implied connection between PM exposure during the whole pregnancy and/or trimester-specific periods and low birthweight, the assessments were obtained completely), outcome definition, covariates in the final model, and OR/RR/hazard ratio estimates with corresponding 95% CIs for all categories, continuous exposure of interest, or both, from each included research.
As gaseous pollutants were often different among studies, we obtained assessments from models of a single pollutant for results that covariates were fully modified. In this meta-analysis, we preferred the results that would depend on a larger number of pollutants.
For instance, we extracted the study of Michael Brauer et al. [24-25] over those from[26] for the results because the former study covered both PM2.5 and PM10 for the assessment method based on the monitoring network being more common across present studies. We preferentially chose this method to potentially reduce the heterogeneity among researches in this study.
Various studies have been reported with different increments (e.g., increased with an interquartile range) or compared to a reference category. To pool estimates from the studies enrolled in, all risk estimates (OR) of PM10 or PM2.5, mass concentrations were converted to a uniform exposure of 10 μg/m3. Effect estimates were categorized by gestational period (whole pregnancy and trimester-specific). Weighting the inverse of the variance, we used a random-effects model to compute the pooled ORs and corresponding 95% CIs for each outcome of interest. Thereafter, the I2 statistic test was assessed to evaluate heterogeneity among estimates from primary studies (50% or less for low-, 51%–75% for moderate-, and 76% or more for high-heterogeneity), respectively. We also performed a series of sensitivity analyses by removing study singly to examine whether the results were strongly influenced by a specific study. Finally, publication bias might have existed and was detected with conducting funnel plot asymmetry, and then we evaluated funnel plot symmetry through Egger's regression.
All two-sided tests were of α = 0.05. Statistically significant findings were considered as those with a pvalue < 0.05. We performed all statistical analyses with Stata version 11.0.
After a systematic search and review, we initially searched a total of 1, 768 published English and Chinese literature; however, after excluding duplicates, reviews, and case-report articles, 1, 650 kinds of literature remained. After glancing at these titles, 1, 523 articles were further excluded as they were considered inappropriate regarding the interested endpoints or exposures. We reviewed the abstracts of the remaining 127 articles in detail. Sixty-two additional papers were removed since they focused on PCB/NO2 exposure to indoor pollution, pollutants from the road, or mechanism researches, leaving 65 articles for an in-depth review. A flow chart of the selection is shown in Fig. 1. After carefully reviewing these articles, we distinguished fourteen for the final analysis from 2004 to 2016[18, 24, 27-38], of which six studies assessed PM2.5 and LBW, twelve studies assessed PM10 and LBW, and three studies assessed both birthweight and LBW. Table 1 (PM2.5-LBW) and Table 2 (PM10-LBW) show the major features of the studies chosen for meta-analysis. Only six articles studied PM2.5 exposure for outcome LBW. Twelve studies used PM10 measures. Four studies provided evaluations for both pollutants. Three studies were from USA, and three studies from Canada, respectively. Others are from the UK, Netherlands, Tehran, Taiwan, Spain, Poland, Brazil, Korea and twelve European countries. Detailed information for all of the included studies can be seen in Tables 1 and 2.
| Ref. | Year | First author | Study location | Study name | No. of birth | Pollutants measured | Exposure assessment | Exposure window | Adjustments | Outcomes | OR (95% CI) |
| 18 | 2013 | Pedersen | 12 European countries | European Study of Cohorts for Air Pollution Effects (ESCAPE) | 74, 178 | PM2.5 | LUR-model | WP | Gestational age, Sex, Parity, Maternal height, Weight before pregnancy, Maternal active smoking during second trimester, Maternal age, Maternal education, Season of conception | TLBW | 1.18 (1.06, 1.33) |
| 24 | 2008 | Brauer | Canada | Cohort | 70, 249 | PM2.5 | Monitor | WP | sex, ethnicity, parity, birth month and year, income, education | TLBW | 1.03 (0.99, 1.07) |
| 30 | 2014 | Ha | USA | retrospective cohort study | 423, 719 | PM2.5 | Hierarchical Bayesian Prediction Model | Maternal education, Ethnicity, Marital status, Maternal age, Infant gender, Prenatal care status, Alcohol, Smoking, Season of conception, Census group income, Urbanicity, presence or absence of maternal risk factor, Infection, PTD status, Co-morbidity | TLBW | W:1.015 (0.989, 1.041), T1:1.007 (0.981, 1.034), T2:1.034 (1.007, 1.061), T3:1.005 (0.980, 1.031) |
|
| 38 | 2014 | Silva | Brazil | population-based retrospective cohort study | 6, 642 | PM2.5 | Model | WP, TS | Newborn sex, Type of delivery, Number of prenatal visits, Mother's education, Age group | TLBW | W:1.33 (0.92, 1.90), T1: 1.02 (0.74, 1.42), T2:1.51 (1.04, 2.17), T3: 1.50 (1.06, 2.15) |
| 32 | 2014 | Dadvand | Spain | cohort | 6, 438 | PM2.5 | LUR-model | WP, TS | Neighborhood SES, Ethnicity, Education level, Marital status, Age, Smoking during pregnancy, Alcohol consumption during pregnancy, Admission BMI < 20 kg/m2, Diabetes, Infection during pregnancy, Parity, Infant sex, Season and year of conception | TLBW | W:1.17 (0.98, 1.39), T1:1.07 (0.88, 1.29), T2:1.19 (0.97, 1.45), T3:1.24 (1.03, 1.49) |
| 33 | 2015 | Poirier | Canada | retrospective cohort | 13, 400 | PM2.5 | LUR-model | WP | Maternal age, Parity, Smoking, Neighborhood income | TLBW | 0.95 (0.89, 1.02) |
 DownLoad:
CSV
DownLoad:
CSV
| Ref. | Year | First author | Study location | Study name/design | No. of birth | Pollutants measured | Exposure assessment | Exposure window | Adjustments | Outcomes | OR (95% CI) |
| 31 | 2015 | Dibben | Scotland | Scottish Longitudinal Study(SLS) | 21, 843 | PM10 | Model | WP | Social class, Parity, Individual estimated income, Ethnicity, Smoking, Mother's age, Mother's education, Season of birth | TLBW | 1.07 (1.01, 1.14) |
| 36 | 2011 | Xu | USA | Birth cohort | 100, 595 | PM10 | Monitor | TS | Maternal age, Maternal race, Maternal education, Smoking, Weight gain, Gender of infant, Gestation age, Parity, Previous LBW or Preterm birth, Level of prenatal care and birth season | TLBW | T1:1.13(1.02, 1.25), T2: 1.10(1.00, 1.22), T3:1.05(0.96, 1.16) |
| 37 | 2007 | Kim | Korea | Birth cohort | 1, 514 | PM10 | Monitor | TS | Infant sex, Infant order, Maternal age and education level, Paternal education level, Season of birth, Alcohol drinking, Maternal body mass index (BMI) and maternal weight | TLBW | T1:1.1 (1.0, 1.2), T3:1.1 (1.0, 1.2) |
| 32 | 2014 | Dadvand | Barcelona | Birth cohort | 6, 438 | PM10 | LUR-model | WP, TS | Neighborhood SES, Ethnicity, Education level, Marital status, Age, Smoking during pregnancy, Alcohol consumption during pregnancy, Admission BMI < 20 kg/m2, Diabetes, Infection during pregnancy, Parity, Infant sex, Season, Year of conception | TLBW | W:1.16 (0.98, 1.37), T1:1.00 (0.82, 1.22), T2:1.20 (0.96, 1.48), T3:1.26 (1.06, 1.51) |
| 33 | 2015 | Poirier | Canada | Birth cohort | 13, 400 | PM10 | LUR-model | WP | Maternal age, Parity, Smoking, Neighborhood income | TLBW | 0.93 (0.88, 0.98) |
DownLoad:
CSV
Table 3 presents the study-specific quality according to Newcastle-Ottawa quality scale.
| Source | Selection* | Comparability† | Outcome‡ | Quality |
| Araban et al., 2012, Tehran(2) | ★★★ | ★★ | ★★ | Moderate |
| Kim et al., 2007, Korea(44) | ★★★★ | ★★ | ★★ | High |
| Hooven et al., 2012, Netherlands(4) | ★★★ | ★★ | ★★ | Moderate |
| Pedersen et al., 2013, 12 European countries(10) | ★★★★ | ★★ | ★★ | High |
| Dugandzic et al., 2006, Canada(17) | ★★★★ | ★★ | ★ | Moderate |
| Lin et al., 2004, Taiwan(18) | ★★★★ | ★★ | ★★ | High |
| Salam et al., 2015, USA(20) | ★★★ | ★★ | ★ | Moderate |
| Brauer et al., 2008, Canada(23) | ★★★★ | ★★ | ★★ | High |
| Ha et al., 2014, USA (25) | ★★★ | ★★ | ★★ | Moderate |
| Silva et al., 2014, Brazil (35) | ★★★ | ★★ | ★★ | Moderate |
| Dibben et al., 2015, UK(42) | ★★★★ | ★★ | ★★ | High |
| Xu et al., 2011, USA(43) | ★★★ | ★★ | ★★★ | High |
| Dadvand et al., 2014, Spain(53) | ★★★★ | ★★ | ★ | Moderate |
| Poirier et al., 2015, Canada (LING) | ★★★★ | ★★ | ★★ | High |
| *Stars awarded for representativeness of the birth cohort, selection of the normal birth cohort, PM exposure during pregnancy, the ascertainment of the diagnostic of the LBW. A maximum of four stars is to be awarded.
†Stars awarded for adjustment of related confounders. A maximum of two stars is to be awarded. ‡ Stars awarded for assessment of LBW, length of follow-up, and adequacy of follow-up cohorts. A maximum of three stars is to be awarded. |
||||
DownLoad:
CSV
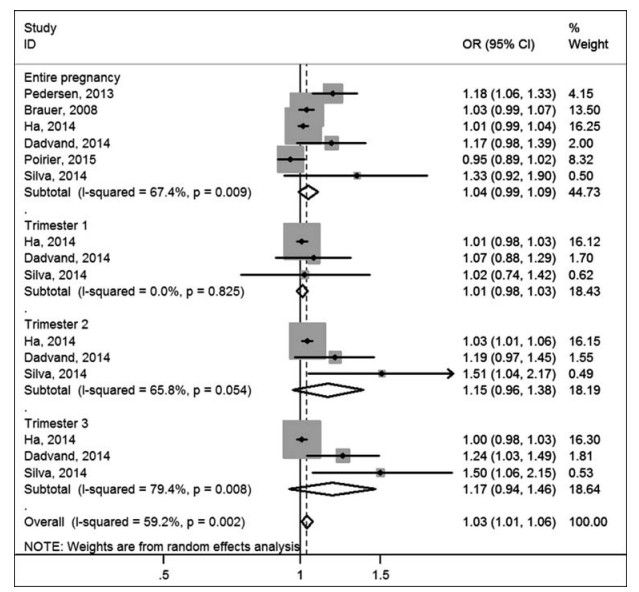
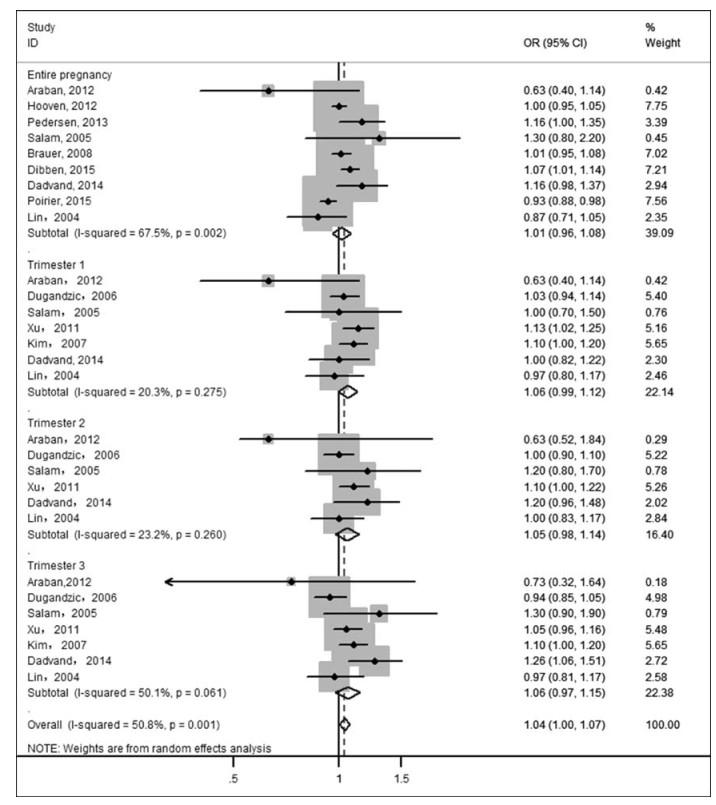
In Fig. 2 and Fig. 3, we estimated overall risks and the risk of LBW caused by PM2.5 was 1.03 (pooled OR, 95% CI: 1.01-1.06) and pooled OR of PM10 was 1.04 (95% CI: 1.00-1.07). Heterogeneity test indicated a moderate heterogeneity among six and twelve articles respectively, which was 59.2% for PM2.5-LBW (P = 0.002) and 50.8% for PM10-LBW (P = 0.001). Random effects model showed summarized ORs and 95% CIs: for PM2.5 during the entire pregnancy: 1.04 (0.99, 1.09); 1st trimester: 1.01 (0.98, 1.03); 2nd trimester: 1.15 (0.96, 1.38) and 3rd trimester: 1.17(0.94, 1.46); for PM10 during the entire pregnancy: 1.01 (0.96, 1.08); 1st trimester: 1.06 (0.99, 1.12); 2nd trimester: 1.05 (0.99, 1.44) and 3rd trimester: 1.06 (0.97, 1.15).
Another subgroup analysis was carried out by the study location (Europe and America; and other regions), study samples (≥1, 000, and < 1, 000), published year (before 2010, and after 2010) and exposure measurement methods (monitor, and model) (Table 4). PM2.5 exposure with study sample below 10, 000 (OR = 1.20, 95% CI: 1.101-1.299, I2 = 0.0%, P = 0.554), study sample above 10, 000 (OR = 1.02, 95% CI: 1.00-1.042, I2 = 56.5%, P = 0.032), published year before 2010 (OR = 1.03, 95% CI: 0.991-1.071, I2 = 0.0%, P = 0.730), after 2010 (OR = 1.034, 95% CI: 1.007-1.061, I2 = 61.8%, P = 0.001); PM10 exposure with study sample below 10, 000 (OR = 1.08, 95% CI: 1.00-1.15, I2 = 45.8%, P = 0.027), study sample above 10, 000 (OR = 1.02, 95% CI: 0.98-1.06, I2 = 54.3%, P = 0.008), published year before 2010 (OR = 1.028, 95% CI: 0.99-1.067, I2 = 13.5%, P = 0.302), after 2010 (OR = 1.047, 95% CI: 0.988-1.11, I2 = 68.1%, P < 0.001), study location at Europe and America (OR = 1.05, 95% CI: 1.01-1.09, I2 = 54.2%, P = 0.003), at Asia (OR = 0.98, 95% CI: 0.90-1.07, I2 = 48.6%, P = 0.041), exposure measurement methods with monitor (OR = 1.03, 95% CI: 0.99-1.08, I2 = 32.7%, P = 0.079), with model (OR = 1.05, 95% CI: 0.99-1.11, I2 = 70.3%, P = 0.001).
| Pollutant | Sub-group | Division | I2 | P-value | pooled OR (95% CI) |
| PM10 | Period | Entire pregnancy | 67.5% | 0.002 | 1.01 (0.96, 1.08) |
| Trimester 1 | 20.3% | 0.275 | 1.06 (0.99, 1.12) | ||
| Trimester 2 | 23.2% | 0.260 | 1.05 (0.98, 1.14) | ||
| Trimester 3 | 50.1% | 0.061 | 1.06 (0.97, 1.15) | ||
| Study area | Asia | 48.6% | 0.041 | 0.98 (0.90, 1.07) | |
| Europe and America | 54.2% | 0.003 | 1.05 (1.01, 1.09) | ||
| Study Sample | ≥10, 000 | 54.3% | 0.008 | 1.02 (0.98, 1.06) | |
| < 10, 000 | 45.8% | 0.027 | 1.08 (1.00, 1.15) | ||
| Published year | ≤2010 | 13.5% | 0.302 | 1.028 (0.99, 1.067) | |
| > 2010 | 68.1% | < 0.001 | 1.047 (0.988, 1.11) | ||
| Assessment | monitor | 32.7% | 0.079 | 1.03 (0.99, 1.08) | |
| model | 70.3% | 0.001 | 1.05 (0.99, 1.11) | ||
| Overall | 50.8% | 0.001 | 1.04(1.00, 1.07) | ||
| PM2.5 | Period | Entire pregnancy | 67.4% | 0.009 | 1.04 (0.99, 1.09) |
| Trimester 1 | 0.0% | 0.825 | 1.01 (0.98, 1.03) | ||
| Trimester 2 | 68.8% | 0.054 | 1.15 (0.96, 1.38) | ||
| Trimester 3 | 79.4% | 0.008 | 1.17 (0.94, 1.46) | ||
| Study Sample | ≥10, 000 | 56.5% | 0.032 | 1.02 (1.00, 1.042) | |
| < 10, 000 | 0.0% | 0.554 | 1.20(1.101, 1.299) | ||
| Published year | ≤2010 | 0.0% | 0.730 | 1.03(0.991, 1.071) | |
| > 2010 | 61.8% | 0.001 | 1.034(1.007, 1.061) | ||
| Overall | 59.2% | 0.002 | 1.03 (1.01, 1.06) |
DownLoad:
CSV
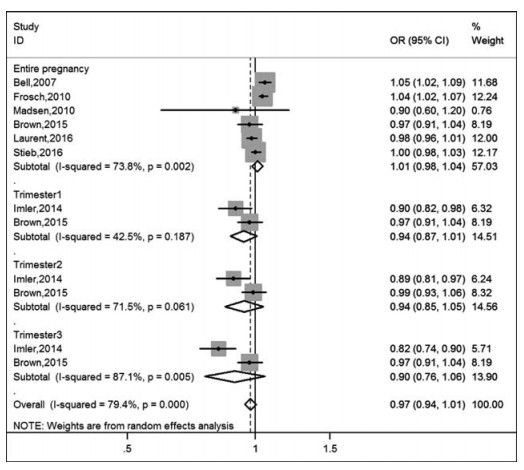
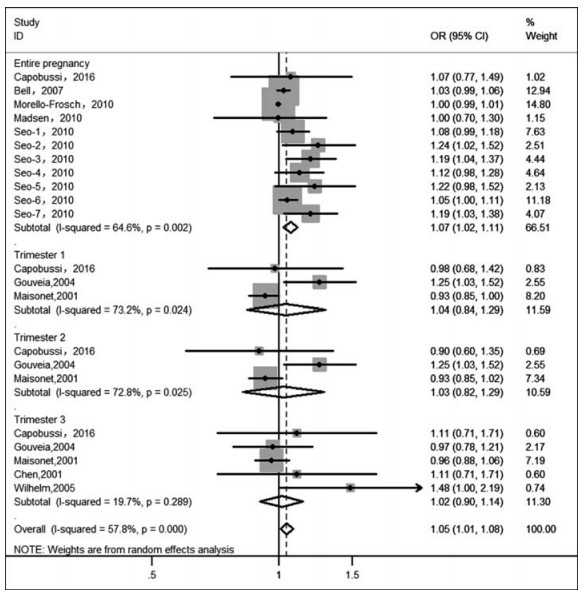
On the other hand, we collected articles which used birth data directly from the national birth registry or hospital-birth records to explore the connection between PM exposure during pregnancy and LBW; the results were displayed in Fig. 4 and Fig. 5. The pooled the estimate of PM10 for the entire pregnancy (OR = 1.07, 95%:1.02, 1.11) was larger than other trimesters, although no statistical significance of the three estimates can be obtained. We also found that heterogeneity was the lowest for the 3rd trimester and the highest for the 1st trimester in Fig. 5.
According to Egger's tests, except for the P-value (P = 0.025) of PM2.5 exposure in the 3rd trimester, no significant publication bias for the two pollutants can be seen in Table 5.
| Pollutant and LBW | Period | Egger's | |
| t | P | ||
| PM10 | Entire pregnancy | 0.31 | 0.764 |
| Trimester 1 | -2.63 | 0.050 | |
| Trimester 2 | -0.79 | 0.475 | |
| Trimester 3 | 0.17 | 0.870 | |
| PM2.5 | Entire pregnancy | 1.43 | 0.225 |
| Trimester 1 | 1.18 | 0.447 | |
| Trimester 2 | 6.30 | 0.100 | |
| Trimester 3 | 25.3 | 0.025 | |
DownLoad:
CSV
Fourteen eligible studies were identified and collected in our meta-analysis, and the associations between the PM mass concentrations and the risk of LBW were quantitatively assessed based on birth cohort studies. Results suggested that maternal exposures to PM during the entire pregnancy and trimesters had a slight positive trend to associate with LBW, but the results were not statistically significant, which consisted well with the findings of the previous meta-analyses. Sapkota et al. reported that slight but formally non-statistically significant increases in risk of LBW was associated with the entire pregnancy PM2.5 (summarized OR: 1.09; 95% CI: 0.90, 1.32) and PM10 exposure (summarized OR: 1.02; 95% CI: 0.99, 1.05)[39]. Although Stieb et al.[6] reported that with a 10 μg/m3 increase for PM2.5 or a 20 μg/m3 increase for PM10, the pooled odds ratios concerning entire pregnancy exposure of PM2.5-LBW and PM10-LBW were 1.05 (0.99–1.12) and 1.10 (1.05– 1.15).
To the best of our knowledge, this is the first metaanalysis study so far reporting on the association between PM pollution and LBW based on birth cohort. All of the studies enrolled in this meta-analysis were birth cohort records and most of these studies did not show an association of statistical significance between PM exposure and LBW. We supposed the reason for the difference lies in that Stieb included the articles based on a national birth registry or state center databases. To verify our supposition, we utilized 21 studies which were directly from databases of various centers.
The in-depth evaluation of the evidence from birth cohorts is one of the main strengths of this review. If all articles were based on registered data, we could not get information comprehensively. A cohort study is an effective way to demonstrate the associations.
More or less, this meta-analysis has some limitations; although less heterogeneity in some subgroups, high or moderate heterogeneities appeared in many of the subgroup analyses. These findings illustrated that the heterogeneity may also be affected by other factors. The socioeconomic status were not investigated due to the limitation in quantity of relevant studies. Accordingly, further studies are warranted to examine the origins of heterogeneity as more meaningful studies are conducted in the future.
| [1] |
Jacobs M, Zhang G, Chen S, et al. The association between ambient air pollution and selected adverse pregnancy outcomes in China: A systematic review[J]. Sci Total Environ, 2017, 579: 1179–1192. doi: 10.1016/j.scitotenv.2016.11.100
|
| [2] |
Dehbi HM, Blangiardo M, Gulliver J, et al. Air pollution and cardiovascular mortality with over 25 years follow-up: A combined analysis of two British cohorts[J]. Environ Int, 2017, 99: 275–281. doi: 10.1016/j.envint.2016.12.004
|
| [3] |
Fajersztajn L, Saldiva P, Pereira LA, et al. Short-term effects of fine particulate matter pollution on daily health events in Latin America: a systematic review and meta-analysis[J]. Int J Public Health, 2017, March 2.
|
| [4] |
Hao Y, Zhang G, Han B, et al. Prospective evaluation of respiratory health benefits from reduced exposure to airborne particulate matter[J]. Int J Environ Health Res, 2017, 27(2): 126–135. doi: 10.1080/09603123.2017.1292497
|
| [5] |
Ha EH, Lee BE, Park HS, et al. Prenatal exposure to PM10 and preterm birth between 1998 and 2000 in Seoul, Korea[J]. J Prev Med Public Health, 2004, 37(4): 300–305. http://www.ncbi.nlm.nih.gov/pubmed/25175610
|
| [6] |
Stieb DM, Chen L, Eshoul M, et al. Ambient air pollution, birth weight and preterm birth: a systematic review and metaanalysis[J]. Environ Res, 2012, 117: 100–111. doi: 10.1016/j.envres.2012.05.007
|
| [7] |
Giovannini N, Schwartz L, Cipriani S, et al. Particulate matter (PM10) exposure, birth and fetal-placental weight and umbilical arterial pH: results from a prospective study[J]. J Matern Fetal Neonatal Med, 2017, April 10: 1–5.
|
| [8] |
Malley CS, Kuylenstierna JC, Vallack HW, et al. Preterm birth associated with maternal fine particulate matter exposure: A global, regional and national assessment[J]. Environ Int, 2017, 101: 173–182. doi: 10.1016/j.envint.2017.01.023
|
| [9] |
Qian Z, Liang S, Yang S, et al. Ambient air pollution and preterm birth: A prospective birth cohort study in Wuhan, China [J]. Int J Hyg Environ Health, 2016, 219(2): 195–203. doi: 10.1016/j.ijheh.2015.11.003
|
| [10] |
Stieb DM, Chen L, Beckerman BS, et al. Associations of pregnancy outcomes and PM2.5 in a national Canadian study [J]. Environ Health Perspect, 2016, 124(2): 243–249. http://europepmc.org/abstract/MED/26090691
|
| [11] |
Den Dekker HT, Sonnenschein-van der Voort AM, de Jongste JC, et al. Early growth characteristics and the risk of reduced lung function and asthma: A meta-analysis of 25, 000 children [J]. J Allergy Clin Immunol, 2016, 137(4): 1026–1035. doi: 10.1016/j.jaci.2015.08.050
|
| [12] |
Goisis A, Özcan B, Myrskylä M. Decline in the negative association between low birth weight and cognitive ability[J]. Proc Natl Acad Sci U S A, 2017, 114(1): 84–88. doi: 10.1073/pnas.1605544114
|
| [13] |
Raaijmakers A, Zhang ZY, Claessens J, et al. Does extremely low birth weight predispose to low-renin hypertension[J]? Hypertension, 2017, 69(3): 443–449. doi: 10.1161/HYPERTENSIONAHA.116.08643
|
| [14] |
Laurent O, Hu J, Li L, et al. Low birth weight and air pollution in California: Which sources and components drive the risk[J]? Environ Int, 2016, 92-93: 471–477. doi: 10.1016/j.envint.2016.04.034
|
| [15] |
Stieb DM, Chen L, Hystad P, et al. A national study of the association between traffic-related air pollution and adverse pregnancy outcomes in Canada, 1999-2008[J]. Environ Res, 2016, 148: 513–526. doi: 10.1016/j.envres.2016.04.025
|
| [16] |
Hao Y, Strosnider H, Balluz L, et al. Geographic variation in the association between ambient fine particulate matter (PM2.5) and term low birth weight in the United States[J]. Environ Health Perspect, 2016, 124(2): 250–255. doi: 10.1289/ehp.1408798
|
| [17] |
Leem JH, Kaplan BM, Shim YK, et al. Exposures to air pollutants during pregnancy and preterm delivery[J]. Environ Health Perspect, 2006, 114(6): 905–910. doi: 10.1289/ehp.8733
|
| [18] |
Pedersen M, Giorgis-Allemand L, Bernard C, et al. Ambient air pollution and low birthweight: a European cohort study (ESCAPE)[J]. Lancet Respir Med, 2013, 1(9): 695–704. doi: 10.1016/S2213-2600(13)70192-9
|
| [19] |
Deeks JJ, Higgins JPT, Altman DG. Analysing Data and Undertaking Meta-Analyses. Cochrane Handbook for Systematic Reviews of Interventions: John Wiley & Sons, Ltd[J], 2008:243–296. http://www.tandfonline.com/servlet/linkout?suffix=CIT0017&dbid=16&doi=10.1080%2F09687637.2017.1285867&key=10.1002%2F9780470712184.ch9
|
| [20] |
Zhu X, Liu Y, Chen Y, et al. Maternal exposure to fine particulate matter (PM2.5) and pregnancy outcomes: a metaanalysis[J]. Environ Sci Pollut Res Int, 2015, 22(5): 3383–3396. doi: 10.1007/s11356-014-3458-7
|
| [21] |
Dadvand P, Parker J, Bell ML, et al. Maternal exposure to particulate air pollution and term birth weight: a multi-country evaluation of effect and heterogeneity[J]. Environ Health Perspect, 2013, 121(3): 367–373. http://www.ncbi.nlm.nih.gov/pubmed/23384584
|
| [22] |
Wang J, Zhang D, Huang R, et al. Gamma-glutamyltransferase and risk of cardiovascular mortality: A dose-response metaanalysis of prospective cohort studies[J]. PLoS One, 2017, 12 (2): e0172631. doi: 10.1371/journal.pone.0172631
|
| [23] |
Wells GA, Shea BJ, O'Connell D, Peterson J, Welch V, Losos M, et al. The Newcastle–Ottawa Scale (NOS) for Assessing the Quality of Non-Randomized Studies in Meta-Analysis[J]. Applied Engineering in Agriculture 2014; 18: págs. 727–734.
|
| [24] |
Brauer M, Lencar C, Tamburic L, et al. A cohort study of trafficrelated air pollution impacts on birth outcomes[J]. Environ Health Perspect, 2008, 116(5): 680–686. doi: 10.1289/ehp.10952
|
| [25] |
Hannam K, McNamee R, Baker P, et al. Air pollution exposure and adverse pregnancy outcomes in a large UK birth cohort: use of a novel spatio-temporal modelling technique[J]. Scand J Work Environ Health, 2014, 40(5): 518–530. doi: 10.5271/sjweh.3423
|
| [26] |
Gehring U, Tamburic L, Sbihi H, et al. Impact of noise and air pollution on pregnancy outcomes[J]. Epidemiology, 2014, 25 (3): 351–358. doi: 10.1097/EDE.0000000000000073
|
| [27] |
Araban M, Kariman N, Tavafian SS, et al. Air pollution and low birth weight: a historical cohort study from Tehran[J]. East Mediterr Health J, 2012, 18(6): 556–560. doi: 10.26719/2012.18.6.556
|
| [28] |
van den Hooven EH, Pierik FH, de Kluizenaar Y, et al. Air pollution exposure during pregnancy, ultrasound measures of fetal growth, and adverse birth outcomes: a prospective cohort study[J]. Environ Health Perspect, 2012, 120(1): 150–156. doi: 10.1289/ehp.1003316
|
| [29] |
Salam MT, Millstein J, Li YF, et al. Birth outcomes and prenatal exposure to ozone, carbon monoxide, and particulate matter: results from the Children's Health Study[J]. Environ Health Perspect, 2005, 113(11): 1638–1644. doi: 10.1289/ehp.8111
|
| [30] |
Ha S, Hu H, Roussos-Ross D, et al. The effects of air pollution on adverse birth outcomes[J]. Environ Res, 2014, 134: 198– 204. doi: 10.1016/j.envres.2014.08.002
|
| [31] |
Dibben C, Clemens T. Place of work and residential exposure to ambient air pollution and birth outcomes in Scotland, using geographically fine pollution climate mapping estimates. Environ Res, 2015, 140: 535–541. doi: 10.1016/j.envres.2015.05.010
|
| [32] |
Dadvand P, Ostro B, Figueras F, et al. Residential proximity to major roads and term low birth weight: the roles of air pollution, heat, noise, and road-adjacent trees. Epidemiology, 2014, 25(4): 518–525. doi: 10.1097/EDE.0000000000000107
|
| [33] |
Poirier A, Dodds L, Dummer T, et al. Maternal exposure to air pollution and adverse birth outcomes in Halifax, Nova Scotia [J]. J Occup Environ Med, 2015, 57(12): 1291–1298. doi: 10.1097/JOM.0000000000000604
|
| [34] |
Lin CM, Li CY, Yang GY, et al. Association between maternal exposure to elevated ambient sulfur dioxide during pregnancy and term low birth weight[J]. Environ Res, 2004, 96(1): 41–50. doi: 10.1016/j.envres.2004.03.005
|
| [35] |
Dugandzic R, Dodds L, Stieb D, et al. The association between low level exposures to ambient air pollution and term low birth weight: a retrospective cohort study[J]. Environ Health, 2006, 5 (1): 3. doi: 10.1186/1476-069X-5-3
|
| [36] |
Xu X, Sharma RK, Talbott EO, et al. PM10 air pollution exposure during pregnancy and term low birth weight in Allegheny County, PA, 1994-2000[J]. Int Arch Occup Environ Health, 2011, 84(3): 251–257. doi: 10.1007/s00420-010-0545-z
|
| [37] |
Kim OJ, Ha EH, Kim BM, et al. PM10 and pregnancy outcomes: a hospital-based cohort study of pregnant women in Seoul[J]. J Occup Environ Med, 2007, 49(12): 1394–1402. doi: 10.1097/JOM.0b013e3181594859
|
| [38] |
Cândido da Silva AM, Moi GP, Mattos IE, et al. Low birth weight at term and the presence of fine particulate matter and carbon monoxide in the Brazilian Amazon: a population-based retrospective cohort study[J]. BMC Pregnancy Childbirth, 2014, 14: 309. doi: 10.1186/1471-2393-14-309
|
| [39] |
Sapkota A, Chelikowsky AP, Nachman KE, et al. Exposure to particulate matter and adverse birth outcomes: a comprehensive review and meta-analysis[J]. Air Qual Atmos Health, 2012, 5 (4):369–381. doi: 10.1007/s11869-010-0106-3
|
| 1. | Dahal U, Veber T, Åström DO, et al. Perinatal Health Inequalities in the Industrial Region of Estonia: A Birth Registry-Based Study. Int J Environ Res Public Health, 2022, 19(18): 11559. DOI:10.3390/ijerph191811559 |
| 2. | Mueller W, Tantrakarnapa K, Johnston HJ, et al. Exposure to ambient particulate matter and biomass burning during pregnancy: associations with birth weight in Thailand. J Expo Sci Environ Epidemiol, 2021, 31(4): 672-682. DOI:10.1038/s41370-021-00295-8 |
| 3. | Nyadanu SD, Tessema GA, Mullins B, et al. Ambient Air Pollution, Extreme Temperatures and Birth Outcomes: A Protocol for an Umbrella Review, Systematic Review and Meta-Analysis. Int J Environ Res Public Health, 2020, 17(22): 8658. DOI:10.3390/ijerph17228658 |
| 4. | Steinle S, Johnston HJ, Loh M, et al. In Utero Exposure to Particulate Air Pollution during Pregnancy: Impact on Birth Weight and Health through the Life Course. Int J Environ Res Public Health, 2020, 17(23): 8948. DOI:10.3390/ijerph17238948 |
| 5. | Tapia VL, Vasquez BV, Vu B, et al. Association between maternal exposure to particulate matter (PM2.5) and adverse pregnancy outcomes in Lima, Peru. J Expo Sci Environ Epidemiol, 2020, 30(4): 689-697. DOI:10.1038/s41370-020-0223-5 |
Figures(5) / Tables(5)
Supported by: Beijing Renhe Information Technology Co., Ltd. E-mail:
info@rhhz.net 
| Ref. | Year | First author | Study location | Study name | No. of birth | Pollutants measured | Exposure assessment | Exposure window | Adjustments | Outcomes | OR (95% CI) |
| 18 | 2013 | Pedersen | 12 European countries | European Study of Cohorts for Air Pollution Effects (ESCAPE) | 74, 178 | PM2.5 | LUR-model | WP | Gestational age, Sex, Parity, Maternal height, Weight before pregnancy, Maternal active smoking during second trimester, Maternal age, Maternal education, Season of conception | TLBW | 1.18 (1.06, 1.33) |
| 24 | 2008 | Brauer | Canada | Cohort | 70, 249 | PM2.5 | Monitor | WP | sex, ethnicity, parity, birth month and year, income, education | TLBW | 1.03 (0.99, 1.07) |
| 30 | 2014 | Ha | USA | retrospective cohort study | 423, 719 | PM2.5 | Hierarchical Bayesian Prediction Model | Maternal education, Ethnicity, Marital status, Maternal age, Infant gender, Prenatal care status, Alcohol, Smoking, Season of conception, Census group income, Urbanicity, presence or absence of maternal risk factor, Infection, PTD status, Co-morbidity | TLBW | W:1.015 (0.989, 1.041), T1:1.007 (0.981, 1.034), T2:1.034 (1.007, 1.061), T3:1.005 (0.980, 1.031) |
|
| 38 | 2014 | Silva | Brazil | population-based retrospective cohort study | 6, 642 | PM2.5 | Model | WP, TS | Newborn sex, Type of delivery, Number of prenatal visits, Mother's education, Age group | TLBW | W:1.33 (0.92, 1.90), T1: 1.02 (0.74, 1.42), T2:1.51 (1.04, 2.17), T3: 1.50 (1.06, 2.15) |
| 32 | 2014 | Dadvand | Spain | cohort | 6, 438 | PM2.5 | LUR-model | WP, TS | Neighborhood SES, Ethnicity, Education level, Marital status, Age, Smoking during pregnancy, Alcohol consumption during pregnancy, Admission BMI < 20 kg/m2, Diabetes, Infection during pregnancy, Parity, Infant sex, Season and year of conception | TLBW | W:1.17 (0.98, 1.39), T1:1.07 (0.88, 1.29), T2:1.19 (0.97, 1.45), T3:1.24 (1.03, 1.49) |
| 33 | 2015 | Poirier | Canada | retrospective cohort | 13, 400 | PM2.5 | LUR-model | WP | Maternal age, Parity, Smoking, Neighborhood income | TLBW | 0.95 (0.89, 1.02) |
DownLoad:
CSV
| Ref. | Year | First author | Study location | Study name/design | No. of birth | Pollutants measured | Exposure assessment | Exposure window | Adjustments | Outcomes | OR (95% CI) |
| 31 | 2015 | Dibben | Scotland | Scottish Longitudinal Study(SLS) | 21, 843 | PM10 | Model | WP | Social class, Parity, Individual estimated income, Ethnicity, Smoking, Mother's age, Mother's education, Season of birth | TLBW | 1.07 (1.01, 1.14) |
| 36 | 2011 | Xu | USA | Birth cohort | 100, 595 | PM10 | Monitor | TS | Maternal age, Maternal race, Maternal education, Smoking, Weight gain, Gender of infant, Gestation age, Parity, Previous LBW or Preterm birth, Level of prenatal care and birth season | TLBW | T1:1.13(1.02, 1.25), T2: 1.10(1.00, 1.22), T3:1.05(0.96, 1.16) |
| 37 | 2007 | Kim | Korea | Birth cohort | 1, 514 | PM10 | Monitor | TS | Infant sex, Infant order, Maternal age and education level, Paternal education level, Season of birth, Alcohol drinking, Maternal body mass index (BMI) and maternal weight | TLBW | T1:1.1 (1.0, 1.2), T3:1.1 (1.0, 1.2) |
| 32 | 2014 | Dadvand | Barcelona | Birth cohort | 6, 438 | PM10 | LUR-model | WP, TS | Neighborhood SES, Ethnicity, Education level, Marital status, Age, Smoking during pregnancy, Alcohol consumption during pregnancy, Admission BMI < 20 kg/m2, Diabetes, Infection during pregnancy, Parity, Infant sex, Season, Year of conception | TLBW | W:1.16 (0.98, 1.37), T1:1.00 (0.82, 1.22), T2:1.20 (0.96, 1.48), T3:1.26 (1.06, 1.51) |
| 33 | 2015 | Poirier | Canada | Birth cohort | 13, 400 | PM10 | LUR-model | WP | Maternal age, Parity, Smoking, Neighborhood income | TLBW | 0.93 (0.88, 0.98) |
DownLoad:
CSV
| Source | Selection* | Comparability† | Outcome‡ | Quality |
| Araban et al., 2012, Tehran(2) | ★★★ | ★★ | ★★ | Moderate |
| Kim et al., 2007, Korea(44) | ★★★★ | ★★ | ★★ | High |
| Hooven et al., 2012, Netherlands(4) | ★★★ | ★★ | ★★ | Moderate |
| Pedersen et al., 2013, 12 European countries(10) | ★★★★ | ★★ | ★★ | High |
| Dugandzic et al., 2006, Canada(17) | ★★★★ | ★★ | ★ | Moderate |
| Lin et al., 2004, Taiwan(18) | ★★★★ | ★★ | ★★ | High |
| Salam et al., 2015, USA(20) | ★★★ | ★★ | ★ | Moderate |
| Brauer et al., 2008, Canada(23) | ★★★★ | ★★ | ★★ | High |
| Ha et al., 2014, USA (25) | ★★★ | ★★ | ★★ | Moderate |
| Silva et al., 2014, Brazil (35) | ★★★ | ★★ | ★★ | Moderate |
| Dibben et al., 2015, UK(42) | ★★★★ | ★★ | ★★ | High |
| Xu et al., 2011, USA(43) | ★★★ | ★★ | ★★★ | High |
| Dadvand et al., 2014, Spain(53) | ★★★★ | ★★ | ★ | Moderate |
| Poirier et al., 2015, Canada (LING) | ★★★★ | ★★ | ★★ | High |
| *Stars awarded for representativeness of the birth cohort, selection of the normal birth cohort, PM exposure during pregnancy, the ascertainment of the diagnostic of the LBW. A maximum of four stars is to be awarded.
†Stars awarded for adjustment of related confounders. A maximum of two stars is to be awarded. ‡ Stars awarded for assessment of LBW, length of follow-up, and adequacy of follow-up cohorts. A maximum of three stars is to be awarded. |
||||
DownLoad:
CSV
| Pollutant | Sub-group | Division | I2 | P-value | pooled OR (95% CI) |
| PM10 | Period | Entire pregnancy | 67.5% | 0.002 | 1.01 (0.96, 1.08) |
| Trimester 1 | 20.3% | 0.275 | 1.06 (0.99, 1.12) | ||
| Trimester 2 | 23.2% | 0.260 | 1.05 (0.98, 1.14) | ||
| Trimester 3 | 50.1% | 0.061 | 1.06 (0.97, 1.15) | ||
| Study area | Asia | 48.6% | 0.041 | 0.98 (0.90, 1.07) | |
| Europe and America | 54.2% | 0.003 | 1.05 (1.01, 1.09) | ||
| Study Sample | ≥10, 000 | 54.3% | 0.008 | 1.02 (0.98, 1.06) | |
| < 10, 000 | 45.8% | 0.027 | 1.08 (1.00, 1.15) | ||
| Published year | ≤2010 | 13.5% | 0.302 | 1.028 (0.99, 1.067) | |
| > 2010 | 68.1% | < 0.001 | 1.047 (0.988, 1.11) | ||
| Assessment | monitor | 32.7% | 0.079 | 1.03 (0.99, 1.08) | |
| model | 70.3% | 0.001 | 1.05 (0.99, 1.11) | ||
| Overall | 50.8% | 0.001 | 1.04(1.00, 1.07) | ||
| PM2.5 | Period | Entire pregnancy | 67.4% | 0.009 | 1.04 (0.99, 1.09) |
| Trimester 1 | 0.0% | 0.825 | 1.01 (0.98, 1.03) | ||
| Trimester 2 | 68.8% | 0.054 | 1.15 (0.96, 1.38) | ||
| Trimester 3 | 79.4% | 0.008 | 1.17 (0.94, 1.46) | ||
| Study Sample | ≥10, 000 | 56.5% | 0.032 | 1.02 (1.00, 1.042) | |
| < 10, 000 | 0.0% | 0.554 | 1.20(1.101, 1.299) | ||
| Published year | ≤2010 | 0.0% | 0.730 | 1.03(0.991, 1.071) | |
| > 2010 | 61.8% | 0.001 | 1.034(1.007, 1.061) | ||
| Overall | 59.2% | 0.002 | 1.03 (1.01, 1.06) |
DownLoad:
CSV
| Pollutant and LBW | Period | Egger's | |
| t | P | ||
| PM10 | Entire pregnancy | 0.31 | 0.764 |
| Trimester 1 | -2.63 | 0.050 | |
| Trimester 2 | -0.79 | 0.475 | |
| Trimester 3 | 0.17 | 0.870 | |
| PM2.5 | Entire pregnancy | 1.43 | 0.225 |
| Trimester 1 | 1.18 | 0.447 | |
| Trimester 2 | 6.30 | 0.100 | |
| Trimester 3 | 25.3 | 0.025 | |
DownLoad:
CSV